


In Short : Power demand refers to the amount of electricity required by consumers, while generation capacity indicates the maximum electricity that power plants can produce. The balance between the two determines grid stability and energy security. Rapid economic growth, urbanization, and electrification are driving higher demand, making capacity expansion and efficient management critical for reliable and sustainable power systems.
In Detail : There is adequate availability of power in the country. Present installed generation capacity of the country is 513.730 GW. Government of India has addressed the critical issue of power deficiency by adding 289.607 GW of fresh generation capacity since April, 2014 transforming the country from power deficit to power sufficient.
Country has successfully met the all-time maximum demand of 250 GW last year. The details of all India Power Supply Position in the country in terms of Energy and Peak during the last three financial years and current financial year 2025-26 (up to December, 2025) are given at Annexure-I. The gap between ‘Energy Supplied’ and ‘Energy Requirement’ has declined from 0.5% during FY 2022-23 to ‘NIL’ during the current year. Similarly, the Peak Demand not met has declined from 4.0% during 2022-23 to almost “NIL” during the current year.
The State-wise / UT details of Power Supply Position for last three financial years and the current financial year i.e. 2025-26 (up to December, 2025) is given at Annexure-II. These details indicate that ‘Energy Supplied’ has been commensurate to the ‘Energy Requirement’ with only a marginal gap which is generally on account of constraints in the State transmission / Distribution network. Hence there is no impact of shortage on the economy and industrial growth.
Electricity being a concurrent subject, the supply and distribution of electricity is responsibility of the respective State Government / Distribution Utility. Hence, it is the responsibility of the respective distribution utility to take necessary actions to provide 24×7 reliable and quality power to the consumers. The Central Government supplements the efforts of the State Governments by establishing power plants through Central Public Sector Undertakings (CPSUs) and making power available to the various States / UTs.
The following steps have been taken to ensure uninterrupted power supply in the country during high demand period: –
- Hydro based generation is being scheduled in a manner so as to conserve water for meeting demand during peak period.
- Planned maintenance of generating units is minimized during period of high demand.
- Steady supply of coal to all the thermal power plants is ensured to prevent fuel shortages.
- Gas-based power plants of NTPC as well as other generators are scheduled during high power demand period.
- All the GENCOs including IPPs and Central generating stations have been advised to generate and maintain full availability on daily basis excluding the period of planned maintenance or forced outage.
- A robust national grid has been established to facilitate the transfer of power from power surplus regions to power deficit regions. The capacity of National Grid is being expanded on a continuous basis commensurate with the growth in electricity generation and electricity demand.
- Proactive monitoring of generation projects under construction to facilitate commensurate capacity addition.
- The Electricity market has been reformed by adding the Real Time Market (RTM), Green Day Ahead Market (GDAM), Green Term Ahead Market (GTAM), High Price Day Ahead Market (HP-DAM) in Power Exchanges. Also, DEEP Portal (Discovery of Efficient Electricity Price) for e-Bidding and e-Reverse for procurement of short-term power by DISCOMs was introduced.
The Government have taken the following steps to strengthen the stability of the national grid and ensure adequate reserve capacity:
- Generation & Storage Planning:
- As per National Electricity Plan (NEP), installed generation capacity in 2031-32 is likely to be 874 GW. With a view to ensure generation capacity remains ahead of projected peak demand, all the States, in consultation with CEA, have prepared their “Resource Adequacy Plans (RAPs)”, which are dynamic 10-year rolling plans and includes power generation as well as power procurement planning.
- All the States were advised to initiate process for creating/ contracting generation capacities; from all generation sources, as per their Resource Adequacy Plans.
- In order to augment the power generation capacity, the Government of India has initiated following capacity addition programme:
(A) The projected thermal (coal and lignite) capacity requirement by the year 2034–35 is estimated at approximately 3,07,000 MW as against the 2,11,855 MW installed capacity as on 31.03.2023. To meet this requirement, Ministry of Power has envisaged to set up an additional minimum 97,000 MW coal and lignite based thermal capacity.
To meet this requirement, several initiatives have already been undertaken. Thermal capacities of around 17,360 MW have already been commissioned since April 2023 till 20.01.2026. In addition, 39,545 MW of thermal capacity (including 4,845 MW of stressed thermal power projects) is currently under construction. The contracts of 22,920 MW have been awarded and is due for construction. Further, 24,020 MW of coal and lignite-based candidate capacity has been identified which is at various stages of planning in the country.
(B) 12,973.5 MW of Hydro Electric Projects are under construction. Further, 4,274 MW of Hydro Electric Projects are under various stage of planning and targeted to be completed by 2031-32.
(C) 6,600 MW of Nuclear Capacity is under construction and targeted to be completed by 2029-30. 7,000 MW of Nuclear Capacity is under various stages of planning and approval.
(D) 1,57,800 MW Renewable Capacity including 67,280 MW of Solar, 6,500 MW of Wind and 60,040 MW Hybrid power is under construction while 48,720 MW of Renewable Capacity including 35,440 MW of Solar and 11,480 MW Hybrid Power is at various stages of planning and targeted to be completed by 2029-30.
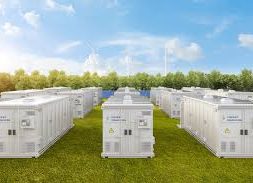
(E) In energy storage systems, 11,620 MW/69,720 MWh Pumped Storage Projects (PSPs) are under construction. Further, a total of 6,580 MW/39,480 MWh capacity of Pumped Storage Projects (PSPs) are concurred and yet to be taken up for construction. Currently, 9,653.94 MW/ 26,729.32 MWh Battery Energy Storage System (BESS) capacity are under construction and 19,797.65 MW/ 61,013.40 MWh BESS capacity are under tendering stage
II. Transmission Planning:
Inter and Intra-State Transmission System has been planned and implementation of the same is taken up in matching time frame of generation capacity addition. As per the National Electricity Plan, about 1,91,474 ckm of transmission lines and 1,274 GVA of transformation capacity is planned to be added (at 220 kV and above voltage level) during the ten-year period from 2022-23 to 2031-32.
III. Promotion of Renewable Energy Generation:
- 100% Inter State Transmission System (ISTS) charges have been waived for inter-state sale of solar and wind power for projects to be commissioned by 30th June 2025 (with waiver tapering off 25% annually till June 2028), for co-located BESS projects commissioned by June 2028, for Hydro PSP projects where construction work awarded by June 2028, for Green Hydrogen Projects commissioned till December 2030 and for offshore wind projects commissioned till December 2032.
- Standard Bidding Guidelines for tariff based competitive bidding process for procurement of Power from Grid Connected Solar, Wind, Wind-Solar Hybrid and Firm & Dispatchable RE (FDRE) projects have been issued.
- Renewable Energy Implementing Agencies (REIAs) are regularly inviting bids for procurement of RE power.
- Foreign Direct Investment (FDI) has been permitted up to 100 percent under the automatic route.
- To augment transmission infrastructure needed for steep RE trajectory, transmission plan has been prepared till 2032.
- Laying of new intrastate transmission lines and creating new sub-station capacity has been supported under the Green Energy Corridor Scheme for evacuation of renewable power.
- Scheme for setting up of Solar Parks and Ultra Mega Solar Power projects is being implemented to provide land and transmission to RE developers for installation of RE projects at large scale
- Schemes such as Pradhan Mantri Kisan Urja Suraksha evam Utthaan Mahabhiyan (PM-KUSUM), PM Surya Ghar Muft Bijli Yojana, National Programme on High Efficiency Solar PV Modules, New Solar Power Scheme (for Tribal and PVTG Habitations/Villages) under Pradhan Mantri Janjati Adivasi Nyaya Maha Abhiyan (PM JANMAN) and Dharti Aabha Janjatiya Gram Utkarsh Abhiyan (DA JGUA), National Green Hydrogen Mission, Viability Gap Funding (VGF) Scheme for Offshore Wind Energy Projects have been launched
- To encourage RE consumption, Renewable Purchase Obligation (RPO) followed by Renewable Consumption Obligation (RCO) trajectory has been notified till 2029-30. The RCO which is applicable to all designated consumers under the Energy Conservation Act, 2001 will attract penalties on non-compliance.
- “Strategy for Establishment of Offshore Wind Energy Projects” has been issued.
- Green Term Ahead Market (GTAM) has been launched to facilitate sale of Renewable Energy Power through exchanges.
- Production Linked Incentive (PLI) scheme has been launched to achieve the objective of localization of supply chain for solar PV Modules.
To strengthen the stability of the national grid and ensure adequate reserve capacity, Central Electricity Regulatory Commission (CERC) has notified the Ancillary Services Regulations, 2022. While maintenance of adequate reserves at the State level within each control area, as stipulated in the Grid Code, remains essential for grid security, the Regulations provide a structured framework for procurement, deployment, and settlement of ancillary services at the regional and national level. These mechanisms, through both administered and market-based approaches, enable effective frequency control, help maintain grid frequency close to 50 Hz, facilitate restoration of frequency within permissible limits, and address transmission congestion, thereby ensuring safe, secure, and reliable operation of the national power system.
As on 31st March 2025, a total of 76 power plants with an installed capacity of 73.3 GW have been successfully wired under Automatic Grid Control (AGC) and are regularly operating round the clock under Secondary Reserve Ancillary Service (SRAS), whenever available.
Reserves under Tertiary Reserve Ancillary Service (TRAS) are procured through power exchanges in Day-Ahead Ancillary Market and Real-Time Ancillary market. TRAS provisions have also been included in the Indian Electricity Grid Code (IEGC), 2023 implemented from 1st October 2023.
As per Indian Electricity Grid Code (IEGC) Clause 31.2(a), each State Load Dispatch Centre (SLDC) is mandated to carry out demand estimation as part of operational planning, after duly factoring in the demand estimation undertaken by the State Transmission Utility (STU) under resource adequacy planning. Accordingly, demand forecasting is carried out across multiple time horizons, daily, weekly, monthly, and yearly, to support secure and reliable grid operation.
A structured mechanism has been established for regular data exchange and coordination among SLDCs, RLDCs, and NLDC. RLDCs regularly intimate States within their respective control areas regarding the likely load -generation balance in the day-ahead as well as real-time timeframes.
Government of India has implemented Deen Dayal Upadhyaya Gram Jyoti Yojana (DDUGJY) for rural electrification and to strengthen the sub-transmission and distribution networks in rural areas in the country. As reported by the States, all the inhabited un-electrified census villages in the country were electrified by 28th April 2018. A total of 18,374 villages in the country were electrified under the scheme of DDUGJY out of which 2,583 villages were electrified in Jharkhand including Chatra Parliamentary Constituency.
Govt. of India launched the Pradhan Mantri Sahaj Bijli Har Ghar Yojana (SAUBHAGYA) in October, 2017 with the objective of providing electricity connections to all willing un-electrified households in rural areas and all willing poor households in urban areas in the country. As reported by the States, around 2.86 Cr. households in the country were electrified during the SAUBHAGYA period out of which 17,30,708 households were electrified in Jharkhand including Chatra Parliamentary Constituency.
Further, Government of India in line with its commitment, is further supporting States under the ongoing Scheme of Revamped Distribution Sector Scheme (RDSS) for electrification of any left-out households. Till date, works amounting to Rs. 6521.85 Cr. have been sanctioned for electrification of 13,65,139 households in the country including Rs.206.12 Cr. for 40,454 households in Jharkhand.
The ongoing RDSS scheme aims at bringing down the AT&C losses to pan-India level of 12-15% and ACS-ARR gap to zero. Under the Scheme, projects worth Rs. 2.84 lakh crore have been sanctioned. These involve distribution infrastructure works worth Rs. 1.53 lakh crore which include replacement of old/frayed conductors, laying Low Tension Aerial Bunched (LT AB) cables, and upgradation/augmentation of Distribution Transformers (DT) / Sub-stations, agriculture feeder segregation etc. The fund release under the scheme has been linked to performance of distribution utilities against various financial parameters, the prominent among them being AT&C losses and ACS-ARR Gap.
Further, Smart metering at consumer, DT and feeder level is one of the critical interventions envisaged under RDSS, allowing the DISCOMs for measurement of energy flows at all level as well as energy accounting without any human interference. Proper and accurate energy accounting is the key to identification of high loss areas and theft prone areas, whereby, utilities’ billing and collection efficiencies improves significantly, thereby reducing the AT&C losses of DISCOMs.
With the collective effort of Centre and States / UTs, at the national level, the AT&C loss of the distribution utilities has reduced from 21.91% in FY2021 to 15.04% in FY2025.
This Information was given by The Minister of State in the Ministry of Power, Shri Shripad Naik, in a written reply in the Lok Sabha today.
***********
NR/AP/MD
ANNEXURE-I
ANNEXURE REFERRED IN REPLY TO PARTS (a) TO (d) OF UNSTARRED QUESTION NO. 966 ANSWERED IN THE LOK SABHA ON 05.02.2026
Details of all India Power Supply Position in the country in terms of Energy and Peak during the last three financial years and current financial year 2025-26 (up to December, 2025):
| Financial Year (FY) | Energy [in Million Unit (MU)] | Peak [in Mega Watt (MW)] | ||||||
| Energy Requirement | Energy Supplied | Energy not Supplied | Peak Demand | Peak Met | Demand Not Met | |||
| (MU) | (MU) | (MU) | ( % ) | (MW) | (MW) | (MW) | (%) | |
| 2022-23 | 15,13,497 | 15,05,914 | 7,583 | 0.5 | 2,15,888 | 2,07,231 | 8,657 | 4.0 |
| 2023-24 | 16,26,132 | 16,22,020 | 4,112 | 0.3 | 2,43,271 | 2,39,931 | 3,340 | 1.4 |
| 2024-25 | 16,93,959 | 16,92,369 | 1,590 | 0.1 | 2,49,856 | 2,49,854 | 2 | 0.0 |
| 2025-26 (up to
December, 2025) |
12,85,913 | 12,85,553 | 360 | 0.0 | 2,42,773 | 2,42,493 | 280 | 0.1 |
***************
ANNEXURE-II
ANNEXURE REFERRED IN REPLY TO PARTS (a) TO (d) OF UNSTARRED QUESTION NO. 966 ANSWERED IN THE LOK SABHA ON 05.02.2026
*************
| State/ | April, 2022 – March, 2023 | April, 2023 – March, 2024 | ||||||
| System / | Energy Requirement | Energy Supplied | Energy not Supplied | Energy Requirement | Energy Supplied | Energy not Supplied | ||
| Region | ( MU ) | ( MU ) | ( MU ) | ( % ) | ( MU ) | ( MU ) | ( MU ) | ( % ) |
| Chandigarh | 1,788 | 1,788 | 0 | 0.0 | 1,789 | 1,789 | 0 | 0.0 |
| Delhi | 35,143 | 35,133 | 10 | 0.0 | 35,501 | 35,496 | 5 | 0.0 |
| Haryana | 61,451 | 60,945 | 506 | 0.8 | 63,983 | 63,636 | 348 | 0.5 |
| Himachal Pradesh | 12,649 | 12,542 | 107 | 0.8 | 12,805 | 12,767 | 38 | 0.3 |
| Jammu & Kashmir | 19,639 | 19,322 | 317 | 1.6 | 20,040 | 19,763 | 277 | 1.4 |
| Punjab | 69,522 | 69,220 | 302 | 0.4 | 69,533 | 69,528 | 5 | 0.0 |
| Rajasthan | 1,01,801 | 1,00,057 | 1,745 | 1.7 | 1,07,422 | 1,06,806 | 616 | 0.6 |
| Uttar Pradesh | 1,44,251 | 1,43,050 | 1,201 | 0.8 | 1,48,791 | 1,48,287 | 504 | 0.3 |
| Uttarakhand | 15,647 | 15,386 | 261 | 1.7 | 15,644 | 15,532 | 112 | 0.7 |
| Northern Region | 4,63,088 | 4,58,640 | 4,449 | 1.0 | 4,76,852 | 4,74,946 | 1,906 | 0.4 |
| Chhattisgarh | 37,446 | 37,374 | 72 | 0.2 | 39,930 | 39,872 | 58 | 0.1 |
| Gujarat | 1,39,043 | 1,38,999 | 44 | 0.0 | 1,45,768 | 1,45,740 | 28 | 0.0 |
| Madhya Pradesh | 92,683 | 92,325 | 358 | 0.4 | 99,301 | 99,150 | 151 | 0.2 |
| Maharashtra | 1,87,309 | 1,87,197 | 111 | 0.1 | 2,07,108 | 2,06,931 | 176 | 0.1 |
| Dadra & Nagar Haveli and Daman & Diu | 10,018 | 10,018 | 0 | 0.0 | 10,164 | 10,164 | 0 | 0.0 |
| Goa | 4,669 | 4,669 | 0 | 0.0 | 5,111 | 5,111 | 0 | 0.0 |
| Western Region | 4,77,393 | 4,76,808 | 586 | 0.1 | 5,17,714 | 5,17,301 | 413 | 0.1 |
| Andhra Pradesh | 72,302 | 71,893 | 410 | 0.6 | 80,209 | 80,151 | 57 | 0.1 |
| Telangana | 77,832 | 77,799 | 34 | 0.0 | 84,623 | 84,613 | 9 | 0.0 |
| Karnataka | 75,688 | 75,663 | 26 | 0.0 | 94,088 | 93,934 | 154 | 0.2 |
| Kerala | 27,747 | 27,726 | 21 | 0.1 | 30,943 | 30,938 | 5 | 0.0 |
| Tamil Nadu | 1,14,798 | 1,14,722 | 77 | 0.1 | 1,26,163 | 1,26,151 | 12 | 0.0 |
| Puducherry | 3,051 | 3,050 | 1 | 0.0 | 3,456 | 3,455 | 1 | 0.0 |
| Lakshadweep | 64 | 64 | 0 | 0.0 | 64 | 64 | 0 | 0.0 |
| Southern Region | 3,71,467 | 3,70,900 | 567 | 0.2 | 4,19,531 | 4,19,293 | 238 | 0.1 |
| Bihar | 39,545 | 38,762 | 783 | 2.0 | 41,514 | 40,918 | 596 | 1.4 |
| DVC | 26,339 | 26,330 | 9 | 0.0 | 26,560 | 26,552 | 8 | 0.0 |
| Jharkhand | 13,278 | 12,288 | 990 | 7.5 | 14,408 | 13,858 | 550 | 3.8 |
| Odisha | 42,631 | 42,584 | 47 | 0.1 | 41,358 | 41,333 | 25 | 0.1 |
| West Bengal | 60,348 | 60,274 | 74 | 0.1 | 67,576 | 67,490 | 86 | 0.1 |
| Sikkim | 587 | 587 | 0 | 0.0 | 544 | 543 | 0 | 0.0 |
| Andaman- Nicobar | 348 | 348 | 0 | 0.12914 | 386 | 374 | 12 | 3.2 |
| Eastern Region | 1,82,791 | 1,80,888 | 1,903 | 1.0 | 1,92,013 | 1,90,747 | 1,266 | 0.7 |
| Arunachal Pradesh | 915 | 892 | 24 | 2.6 | 1,014 | 1,014 | 0 | 0.0 |
| Assam | 11,465 | 11,465 | 0 | 0.0 | 12,445 | 12,341 | 104 | 0.8 |
| Manipur | 1,014 | 1,014 | 0 | 0.0 | 1,023 | 1,008 | 15 | 1.5 |
| Meghalaya | 2,237 | 2,237 | 0 | 0.0 | 2,236 | 2,066 | 170 | 7.6 |
| Mizoram | 645 | 645 | 0 | 0.0 | 684 | 684 | 0 | 0.0 |
| Nagaland | 926 | 873 | 54 | 5.8 | 921 | 921 | 0 | 0.0 |
| Tripura | 1,547 | 1,547 | 0 | 0.0 | 1,691 | 1,691 | 0 | 0.0 |
| North-Eastern Region | 18,758 | 18,680 | 78 | 0.4 | 20,022 | 19,733 | 289 | 1.4 |
| All India | 15,13,497 | 15,05,914 | 7,583 | 0.5 | 16,26,132 | 16,22,020 | 4,112 | 0.3 |
The State-wise/ UT details of Power Supply Position for last three financial years and the current financial year i.e. 2025-26 (up to December, 2025):
( Figures in MU )
The State-wise/ UT details of Power Supply Position for last three financial years and the current financial year i.e. 2025-26 (up to December, 2025)
(Figures in MU )
| State/ | April, 2024 – March, 2025 | April, 2025 – December, 2025 | ||||||
| System / | Energy Requirement | Energy Supplied | Energy not Supplied | Energy Requirement | Energy Supplied | Energy not Supplied | ||
| Region | ( MU ) | ( MU ) | ( MU ) | ( % ) | ( MU ) | ( MU ) | ( MU ) | ( % ) |
| Chandigarh | 1,952 | 1,952 | 0 | 0.0 | 1,509 | 1,509 | 1 | 0.0 |
| Delhi | 38,255 | 38,243 | 12 | 0.0 | 31,006 | 30,999 | 7 | 0.0 |
| Haryana | 70,149 | 70,120 | 30 | 0.0 | 55,932 | 55,867 | 65 | 0.1 |
| Himachal Pradesh | 13,566 | 13,526 | 40 | 0.3 | 10,329 | 10,294 | 36 | 0.3 |
| Jammu & Kashmir | 20,374 | 20,283 | 90 | 0.4 | 14,874 | 14,862 | 12 | 0.1 |
| Punjab | 77,423 | 77,423 | 0 | 0.0 | 60,827 | 60,786 | 41 | 0.1 |
| Rajasthan | 1,13,833 | 1,13,529 | 304 | 0.3 | 82,763 | 82,763 | 0 | 0.0 |
| Uttar Pradesh | 1,65,090 | 1,64,786 | 304 | 0.2 | 1,29,329 | 1,29,304 | 26 | 0.0 |
| Uttarakhand | 16,770 | 16,727 | 43 | 0.3 | 12,630 | 12,582 | 49 | 0.4 |
| Northern Region | 5,18,869 | 5,17,917 | 952 | 0.2 | 4,00,413 | 4,00,176 | 236 | 0.1 |
| Chhattisgarh | 43,208 | 43,180 | 28 | 0.1 | 31,502 | 31,494 | 8 | 0.0 |
| Gujarat | 1,51,878 | 1,51,875 | 3 | 0.0 | 1,17,364 | 1,17,364 | 0 | 0.0 |
| Madhya Pradesh | 1,04,445 | 1,04,312 | 133 | 0.1 | 75,081 | 75,073 | 8 | 0.0 |
| Maharashtra | 2,01,816 | 2,01,757 | 59 | 0.0 | 1,48,848 | 1,48,839 | 9 | 0.0 |
| Dadra & Nagar Haveli and Daman & Diu | 10,852 | 10,852 | 0 | 0.0 | 8,439 | 8,439 | 0 | 0.0 |
| Goa | 5,411 | 5,411 | 0 | 0.0 | 4,086 | 4,086 | 0 | 0.0 |
| Western Region | 5,28,924 | 5,28,701 | 223 | 0.0 | 3,95,551 | 3,95,526 | 25 | 0.0 |
| Andhra Pradesh | 79,028 | 79,025 | 3 | 0.0 | 59,543 | 59,537 | 6 | 0.0 |
| Telangana | 88,262 | 88,258 | 4 | 0.0 | 61,062 | 61,055 | 7 | 0.0 |
| Karnataka | 92,450 | 92,446 | 4 | 0.0 | 67,547 | 67,538 | 9 | 0.0 |
| Kerala | 31,624 | 31,616 | 8 | 0.0 | 22,949 | 22,946 | 2 | 0.0 |
| Tamil Nadu | 1,30,413 | 1,30,408 | 5 | 0.0 | 99,901 | 99,892 | 10 | 0.0 |
| Puducherry | 3,549 | 3,549 | 0 | 0.0 | 2,691 | 2,688 | 3 | 0.1 |
| Lakshadweep | 68 | 68 | 0 | 0.0 | 54 | 54 | 0 | 0.0 |
| Southern Region | 4,25,373 | 4,25,349 | 24 | 0.0 | 3,13,730 | 3,13,692 | 38 | 0.0 |
| Bihar | 44,393 | 44,217 | 176 | 0.4 | 37,294 | 37,280 | 13 | 0.0 |
| DVC | 25,891 | 25,888 | 3 | 0.0 | 18,595 | 18,592 | 3 | 0.0 |
| Jharkhand | 15,203 | 15,126 | 77 | 0.5 | 11,735 | 11,731 | 5 | 0.0 |
| Odisha | 42,882 | 42,858 | 24 | 0.1 | 34,064 | 34,059 | 5 | 0.0 |
| West Bengal | 71,180 | 71,085 | 95 | 0.1 | 56,878 | 56,846 | 32 | 0.1 |
| Sikkim | 574 | 574 | 0 | 0.0 | 382 | 382 | 0 | 0.0 |
| Andaman- Nicobar | 425 | 413 | 12 | 2.9 | 318 | 301 | 17 | 5.5 |
| Eastern Region | 2,00,180 | 1,99,806 | 374 | 0.2 | 1,58,993 | 1,58,935 | 58 | 0.0 |
| Arunachal Pradesh | 1,050 | 1,050 | 0 | 0.0 | 909 | 909 | 0 | 0.0 |
| Assam | 12,843 | 12,837 | 6 | 0.0 | 10,973 | 10,973 | 1 | 0.0 |
| Manipur | 1,079 | 1,068 | 10 | 0.9 | 863 | 861 | 3 | 0.3 |
| Meghalaya | 2,046 | 2,046 | 0 | 0.0 | 1,542 | 1,542 | 0 | 0.0 |
| Mizoram | 709 | 709 | 0 | 0.0 | 559 | 559 | 0 | 0.0 |
| Nagaland | 938 | 938 | 0 | 0.0 | 772 | 772 | 0 | 0.0 |
| Tripura | 1,939 | 1,939 | 0 | 0.0 | 1,523 | 1,523 | 0 | 0.0 |
| North-Eastern Region | 20,613 | 20,596 | 16 | 0.1 | 17,228 | 17,224 | 3 | 0.0 |
| All India | 16,93,959 | 16,92,369 | 1,590 | 0.1 | 12,85,913 | 12,85,553 | 360 | 0.0 |
**************