


Summary:
—
### Part A: Power Generation (Source-wise & State-wise including Jharkhand)
This section provides a detailed breakdown of electricity generation over the last five years and the current year (up to January 2026).
**1. National Generation Trend (in Million Units – MUs)**
| Financial Year | Total Conventional (Thermal + Nuclear) | Total Renewable (incl. Large Hydro) | Grand Total (incl. Bhutan Import) | Key Observation |
| :— | :— | :— | :— | :— |
| **2020-21** | 10,75,543 | 2,97,547 | 13,81,855 | Base year for comparison. |
| **2021-22** | 11,61,827 | 3,22,540 | 14,91,859 | Steady growth in both segments. |
| **2022-23** | 12,52,072 | 3,65,651 | 16,24,466 | Renewable generation jumps significantly. |
| **2023-24** | 13,74,486 | 3,59,889 | 17,39,091 | Slight dip in renewables, likely due to hydro variability. |
| **2024-25** | 14,20,571 | 4,03,643 | 18,29,698 | Renewable generation hits a new high. |
| **2025-26 (Upto Jan)** | 11,25,105 | 4,08,365 | 15,41,236 | On track for another record year in renewables. |
– **Renewable Growth:** Renewable energy generation (including Large Hydro) has grown by **~37%** from 2,97,547 MUs in 2020-21 to 4,08,365 MUs in just 10 months of 2025-26. This underscores the rapid pace of the energy transition.
– **Thermal’s Continued Role:** Thermal power (primarily coal) remains the backbone of the grid, growing consistently year-on-year to meet base load demand.
**2. State Focus: Jharkhand’s Power Generation (in MUs)**
The data provides a specific look at Jharkhand’s generation mix, which is heavily dominated by thermal power.
| Source | 2020-21 | 2021-22 | 2022-23 | 2023-24 | 2024-25 | 2025-26 (Upto Jan) |
| :— | :— | :— | :— | :— | :— | :— |
| **Thermal (Coal)** | **27,219.97** | **28,338.72** | **30,472.78** | **35,764.81** | **38,812.21** | **32,911.14** |
| **Renewable (Total)** | 249.56 | 576.67 | N/A | N/A | 293.01 | N/A |
| **Grand Total** | **27,469.53** | N/A | N/A | N/A | **39,105.22** | N/A |
– **Coal Dominance in Jharkhand:** As a resource-rich state, Jharkhand’s generation is overwhelmingly from coal, with a significant upward trend, growing by over 40% from 2020-21 to 2024-25.
– **Nascent RE:** Renewable energy contribution is minimal but shows some growth, indicating potential for future diversification.
—
### Parts (b) & (c): Power Supply Position and Demand Adequacy
This is the most critical section for understanding the health of India’s power sector. It confirms that India is a **power-sufficient nation** with a robust grid.
**1. National Peak Demand & Energy Position (Last 5 Years)**
| Financial Year | Peak Demand (MW) | Peak Met (MW) | Deficit (MW) | Energy Requirement (MU) | Energy Supplied (MU) | Deficit (MU) |
| :— | :— | :— | :— | :— | :— | :— |
| **2020-21** | 1,90,198 | 1,89,395 | 802 (0.4%) | 12,75,534 | 12,70,663 | 4,871 (0.4%) |
| **2021-22** | 2,03,014 | 2,00,539 | 2,475 (1.2%) | 13,79,812 | 13,74,024 | 5,787 (0.4%) |
| **2022-23** | 2,15,888 | 2,07,231 | 8,657 (4.0%) | 15,13,497 | 15,05,914 | 7,583 (0.5%) |
| **2023-24** | 2,43,271 | 2,39,931 | 3,340 (1.4%) | 16,26,132 | 16,22,020 | 4,112 (0.3%) |
| **2024-25** | 2,49,856 | 2,49,854 | **2 (0.0%)** | 16,93,959 | 16,92,369 | 1,590 (0.1%) |
| **2025-26 (Upto Jan)** | 2,45,444 | 2,45,416 | 28 (0.0%) | 14,27,436 | 14,27,009 | 427 (0.0%) |
– **Deficit Near Zero:** The data demonstrates a consistent trend of meeting almost 100% of both peak demand and energy requirements. The marginal deficits (0.0-0.1% in recent years) are officially attributed to local transmission/distribution constraints, not a shortage of generation capacity.
– **Peak Demand Growth:** Peak demand has grown by nearly 30% from ~1.9 Lakh MW in 2020-21 to ~2.5 Lakh MW, indicating strong economic activity and increased electrification. The system has successfully kept pace.
**2. Future Demand Projections**
– **FY 2029-30:** Peak Demand: **345 GW** | Energy Requirement: **2,388 Billion Units (BU)**
– **FY 2031-32:** Peak Demand: **388 GW** | Energy Requirement: **2,703 BU**
These projections, based on the 20th Electric Power Survey, highlight the massive scale of capacity addition required in the next 5-7 years.
—
### Part (d): District-Level Data – Chhindwara, Madhya Pradesh
The data provides a granular view of electricity supply at the district level, useful for local infrastructure planning and industrial investment.
– **Total Units Supplied to Chhindwara District (in MUs):**
– 2020-21: 1,642.70
– 2021-22: 1,703.32
– 2022-23: 1,895.07
– 2023-24: 1,912.29
– 2024-25: 2,106.59
– 2025-26 (Upto Jan): 1,741.55
– **Observation:** The district has seen a steady increase in power supply, growing by over 28% from FY21 to FY25, reflecting rising consumption and improved infrastructure.
—
### Government Strategy to Meet Future Demand (Key Business Opportunities)
The government has outlined a comprehensive, multi-pronged strategy to meet the projected demand of 388 GW by 2031-32, creating significant investment opportunities.
**1. Generation and Storage Planning (Targets by 2031-32)**
| Source | Target/Status | Business Opportunity |
| :— | :— | :— |
| **Thermal (Coal & Lignite)** | Additional **~97,000 MW** by 2034-35 (beyond 2,11,855 MW in 2023). 38,745 MW under construction; 22,920 MW awarded; 24,020 MW planned. | EPC contracts, equipment supply (Boilers, Turbines), coal logistics. |
| **Hydro** | **12,723.5 MW** under construction. Another **4,274 MW** in planning stages. | Civil works, turbine supply, project management. |
| **Nuclear** | **6,600 MW** under construction (by 2029-30). **7,000 MW** in planning/approval. | High-tech component manufacturing, construction, ancillary services. |
| **Renewable (Solar, Wind, Hybrid)** | **1,57,800 MW** under construction (including 67,280 MW Solar, 6,500 MW Wind, 60,040 MW Hybrid). **48,720 MW** in planning (by 2029-30). | Project development, module/cell manufacturing (linked to ALMM), inverter supply, O&M services. |
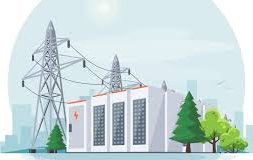
| **Energy Storage** | **PSPs:** 11,620 MW (69,720 MWh) under construction; 6,580 MW (39,480 MWh) concurred. **BESS:** 9,654 MW (26,729 MWh) under construction; 19,798 MW (61,013 MWh) under tendering. | **This is a massive emerging market.** Opportunities in project development, battery assembly, and control systems. |
**2. Key Policy and Regulatory Drivers**
– **Transmission Planning:** ~1,91,474 ckm of lines and 1,274 GVA transformation capacity to be added, creating opportunities in cable, tower, and substation equipment manufacturing.
– **Right of Way (RoW) Guidelines:** New guidelines link compensation to market rates, easing a major hurdle for transmission projects.
– **ISTS Charge Waivers:** Extended for various RE, storage, and green hydrogen projects, improving their financial viability.
– **Renewable Consumption Obligation (RCO):** Mandates for designated consumers with penalties for non-compliance, creating a strong demand pull for RE and energy storage.
– **Production Linked Incentive (PLI) Scheme:** Focused on solar PV modules, encouraging domestic manufacturing.
– **Promotional Schemes:** PM-KUSUM, PM Surya Ghar, National Green Hydrogen Mission, and VGF for offshore wind are opening up new market segments.
—-
For more information please see below link: