


How Facebook’s Predictive Grid Map Can Identify African Off-Grid Market Opportunities


To bring electricity to the 600 million Africans without it, we must first know where they are. New tools are emerging that will allow developers to more efficiently target opportunities.
We are not making progress on reducing the number of people living off-grid in Africa.
A total of $25 billion was spent on energy infrastructure in Africa in 2017, for an average of $20 per person. Yet the number of people living without electricity on the continent has held steady at 600 million, almost 60 percent of Africa’s population.
One reason for this stasis is that many of these people are hard to reach. Approximately 60 percent of Africans live in rural areas where creating a connection to the main grid can be difficult and expensive.
New technology may offer a solution. We have written previously about the exciting potential of off-grid solutions such as mini-grids and solar home systems to offer a credible, cheaper and faster alternative for bringing electricity to people who live far from the main grid.
But in order to connect these people, we must first know where they are.
A persistent challenge for African rural electrification is simply finding and prioritizing communities that can be viably connected to electricity. Some project developers manually trawl through Google satellite imagery to identify potential off-grid sites. This process is both time-consuming and arbitrary.
The good news is that better data and geospatial analytics are emerging. As a result, this process can be made more systematic.
Notably, Facebook in January released a new predictive model for the location of the grid in several African countries. The model incorporates multiple indicators of electrification, including nighttime light and an approach that excludes temporary lighting sources, to identify which communities are on-grid. It then predicts a grid network that connects each of these villages, with a preference for following roads, avoiding water and finding shorter paths.
CrossBoundary has already used this resource to estimate which states and villages in five African countries have the highest off-grid populations. Developers can now use this analysis to better target their project development to have the maximum impact.
This article describes our approach so that others may learn from and build upon it.
Using Facebook’s model to predict off-grid potential
Our estimation of off-grid potential was carried out using three steps for each country:
Using Facebook’s medium-voltage grid map, draw a 1-kilometer radius around the grid to reflect the extension of low-voltage lines. Given that the map’s existing resolution is 1 kilometer, this gives the grid a 3-kilometer catchment area for addressable population, a distance consistent with the technical limits of extending low-voltage lines to customers. Other distances could be used to reflect different markets’ electrification needs (e.g., shorter extension distances if power demand is higher).
Further eliminate any bright spots from the “no-grid” zones using NASA’s nighttime satellite imagery (not differentiating between mobile and stationary light sources).
Apply this filter to hyper-detailed population data to identify who lives outside of the grid’s 3-kilometer catchment area, in places with very little nighttime light.
After calculating who is living off-grid, each country was segmented into states, local government areas and populated villages. Village locations from Geonames.org were used because the additional detail in specifying high potential off-grid villages within a target local government area is important for a company’s entry strategy into a market.
One important caveat is that the grid prediction methodology is still not 100 percent accurate. Facebook claims that its algorithm has 70 percent accuracy based on a mixture of identifying grid lines that official documentation omits, or the algorithm failing to identify documented grid lines.
But the approach yields exciting results. First, previous analysis on publicly available grid data has only been possible with the World Bank’s grid database, which was incomplete and out of date for many countries.
Second, combining the new grid data release with hyper-detailed population estimates yields even more precise results from analysis at the 1 km2 level. These results can give developers an insight into the village layout they will encounter when planning a visit.
The increased granularity delivered by this new analysis can be observed in the following figures that show the grid maps generated for Nigeria from the data set.
Comparison of Facebook-Generated Grid Map and World Bank Grid Map: Nigeria
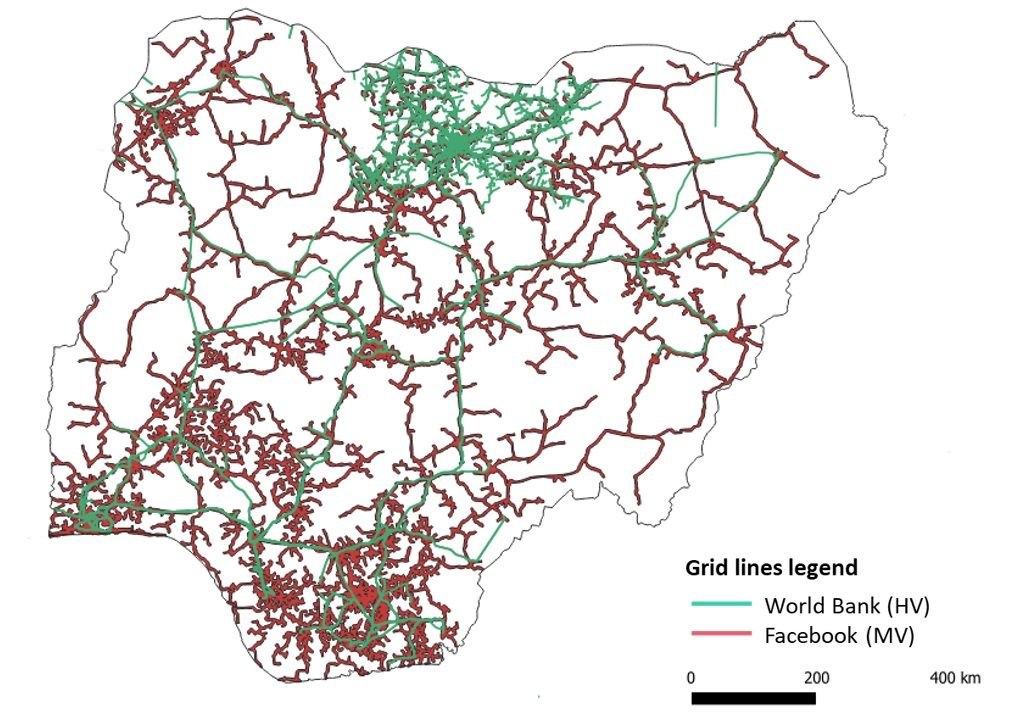
Note: Nigeria’s Rural Electrification Agency showcases a more detailed and up-to-date transmission and distribution dataset that is not incorporated into World Bank data
The results
Our off-grid categorization approach yields a similar or higher electrified population than the World Bank’s estimates in 2016, meaning the analysis does not seem to overstate the off-grid population size.
For each country, we were able to identify high-priority states, local government areas and even villages for potential new market entrants to target. Local government areas can be prioritized based on the number of potential off-grid customers (absolute approach) or the percentage of people living off-grid.
One way this could be useful to developers is to identify village clusters within a highly unelectrified local government area. In Zambia, there are over 4,000 villages with off-grid populations above 500 people. To select a target market, a local government area with a high off-grid population can be identified, and individual villages within this area can be prioritized based on size and proximity to other villages.
In the following example, Kaoma was selected as a high potential local government area. A cluster of villages, Kayambala, Kambotwe and Shibidi, can be identified to the right of the map as a potential entry market for off-grid, since over 12,000 live in this combined market.
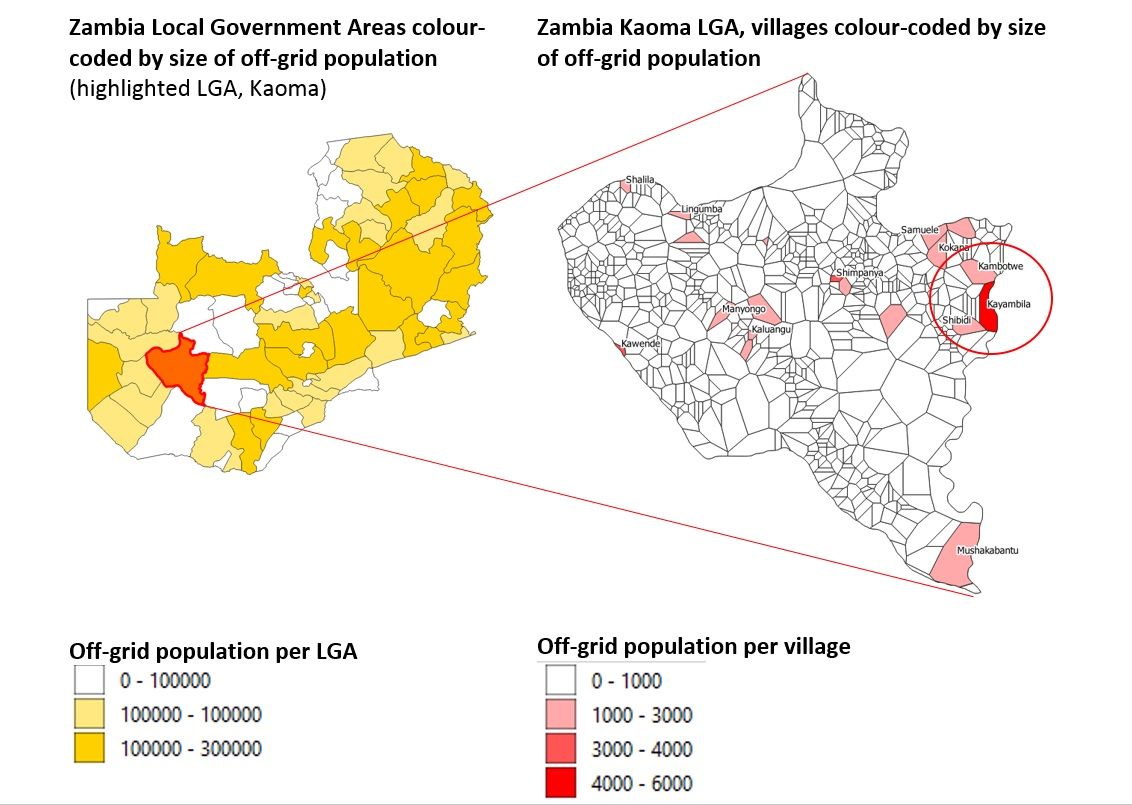
There are, however, limits to this approach based on the accuracy of the data. For example, when zooming in on the Kamabalaya village outlined above, it is possible that the grid map was inaccurate by a few kilometers.
The village concentration in the bottom left corner is very close to the grid above (shown in light green), even after adding a 1-kilometer buffer around the grid map. It is possible that this village is already electrified and may not be a viable candidate for an off-grid company.
What’s next?
Applying this approach to Facebook’s dataset, we are able to identify and prioritize the top villages, local government areas and states for electrification by off-grid companies. Further analysis would stratify these villages by their distance away from the grid and layer in other datasets that could help with planning the launch of new operations, such as proximity to roads and household income levels.
There is also exciting work that could be done with developers to test these granular outputs at the village level against their current development pipeline.
For now, we are grateful to Facebook for sharing this dataset and excited to have a snapshot of where companies should investigate first if they want to launch into some of the top off-grid markets in Africa.