Central Puerto: 147 MW of New Renewable Capacity, 162% Increase in Gross Profits and 12% Increase in Energy Generation


BUENOS AIRES, Argentina: Central Puerto S.A (“Central Puerto” or the “Company”) (NYSE:CEPU), the largest private sector power generation company in Argentina, as measured by generated power, reports its consolidated financial results for the three-month and nine-month periods ended September 30, 2018 (“Third Quarter” or “3Q2018”, and “Nine-month 2018” or “9M2018”, respectively).
A conference call to discuss 3Q2018 financial results will be held on November 13, 2018 at 12:00 p.m. Eastern Time (see details below). All information provided is presented on a consolidated basis, unless otherwise stated.
All figures are expressed in Argentinean Pesos and growth comparisons refer to the same period of the prior year, unless otherwise stated. Definitions and terms used herein are provided in the Glossary at the end of this document. This release does not contain all the Company’s financial information. As a result, investors should read this release in conjunction with Central Puerto’s consolidated financial statements as of and for the nine-month period ended September 30, 2018 and the notes thereto, which will be available on the Company’s website.
A. Third Quarter 2018 Highlights
Energy generation increased 12% to 4,422 GWh, as compared to 3,937 GWh during the same period of 2017 (see section C. Main Operating Metrics).
Construction of Terminal 6 (330 MW) and Luján de Cuyo (93 MW). During the 3Q2018, Central Puerto continued with the civil works and purchase of equipment for the construction of the new cogeneration projects.
Operating income (before other operating results) increased 178% to Ps. 2,054 million after a 128% increase in Revenues, and an 8 p.p. increase in Gross Profit Margins to 66%, compared to 58% in the 3Q2017 (see section D. Financials).
Adjusted EBITDA increased to Ps. 8,808 million in 3Q2018, compared to Ps. 974 million in 3Q2017, mainly due to a Ps. 6,529 million gain in the 3Q2018 as a result of foreign exchange differences and interest accrued on the trade receivables denominated in US dollars (see section D. Financial).
“We had an excellent third quarter. On the operational side, our energy generation increased 12%, as compared to 3% of the total electric energy generation market.
Regarding our renewable projects, our wind farms La Castellana I and Achiras I commenced its operations, adding 147 MW of new capacity to our portfolio, which at the end of the quarter represented 12% of the total renewable installed capacity of Argentina.”
Jorge Rauber, CEO Central Puerto
Renewable Energy
Commercial operation of wind farms La Castellana I and Achiras I: La Castellana I and Achiras I wind farms, with an aggregate installed capacity of 147 MW, started its operations in August and September 2018, respectively.
Purchase of Vientos La Genoveva S.A.U. and Vientos La Genoveva II S.A.U. On August 6, 2018 Central Puerto purchased from its subsidiary CP Renovables S.A., the special purpose vehicle companies (SPVs) Vientos La Genoveva S.A.U. and Vientos La Genoveva II S.A.U., which are developing the wind farms La Genoveva I and La Genoveva II, respectively. As a consequence, Central Puerto S.A. currently holds a 100% direct stake in both projects.
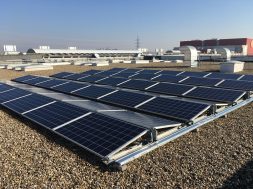
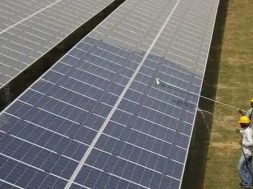
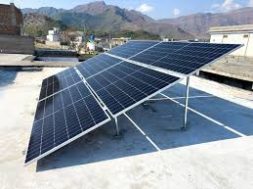
Purchase of the solar project El Puesto. On August 2018 Central Puerto purchased the solar project El Puesto, located in the Province of Catamarca. The project will have a power capacity of 12 MW and will sell its energy to private off-takers under the MATER regulation (“MATER” stands for “Term Market for Renewable Energy”). The expected commercial operation date is August 2020.
B. Recent news
Res. 70/2018. On November 7, 2018 the Secretariat of Energy issued Res. 70/2018, which authorized generators to procure their own fuel for assets under the Energía Base Regulatory framework. If generation companies opt to take this option, CAMMESSA will value and pay the generators their respective fuel costs in accordance with the Variable Costs of Production (CVP) declared by each generator to CAMMESA. According to CAMMESA’s procedure, the machines with the lower CVPs are dispatched first, and consequently, may produce more electric energy.
The Agency in Charge of Dispatch (Organismo Encargado del Despacho or “OED” using the Spanish acronym) -CAMMESA- will continue to supply the fuel for those generation companies that do not elect to take this option.
Application of IAS 29. Given that Argentina’s accumulated triennial inflation, either calculated based on the wholesale price index or the consumer price index, is currently over 100%, and the revised targets of the national government, and other available projections, indicate that this trend will not reverse in the short term, the Argentine economy is currently considered hyperinflationary under IAS 29. Under IAS 29, entities that must prepare their financial statements pursuant to IFRS, and whose functional currency is the Argentine peso, such as Central Puerto, must restate their financial statements relating to annual or intermediate periods closed after July 1, 2018. Such restatement must take place as if the economy had always been hyperinflationary, using a general price index that reflects changes in the purchasing power of the currency.
However, article 3 of Chapter III, Title IV of the Rules of the CNV (N.T. 2013 and amendments) establishes that the entities subject to the control of the CNV cannot apply the restatement method of financial statements in a homogeneous currency provided by IAS 29. This is because Decree No. 1259/2002 (amended by Decree No. 664/2003) instructs CNV not to accept the presentation of financial statements adjusted for inflation. The exclusion of IAS 29 in the application of IFRS will proceed until such a decree is in force.
Although our financial statements as of and for the period ended on September 30, 2018 do not include the effects of the inflation adjustment, the existence of important variations caused by inflation in the factors that affect Central Puerto’s business, such as the wage cost, the prices of the main raw materials and of other inputs, the interest rate of other outstanding indebtedness and the exchange rate, as well as the financial situation and the results of the Company, and, therefore, these variations should be taken into account when reading our financial statements. We include more information on this issue in a note to our financial statements as of and for the nine-month period ended on September 30, 2018.
In accordance with SEC rules, our annual report on Form 20-F for the fiscal year ended December 31, 2018 will include Financial Statements applying IAS 29. As of the date of this release, we are in the process of quantifying the impact of applying IAS 29, which we expect will be significant. We include a summary of the effects that could derive of applying IAS 29 in a note to our financial statements as of and for the nine-month period ended on September 30, 2018.
C. Main operating metrics
The table below sets forth key operating metrics for 3Q2018, compared to 2Q2018 and 3Q2017, and 9M2018, compared to 9M2017:
| Key Metrics |
3Q 2018 |
2Q
2018 |
3Q
2017 |
Var %
(3Q /3Q) |
9M
2018 |
9M
2017 |
Var
% |
||||||||
| Continuing Operations | |||||||||||||||
| Energy Generation (GWh) | 4,422 | 3,145 | 3,937 | 12% | 11,007 | 11,588 | (5%) | ||||||||
| -Electric Energy Generation-Thermal | 2,911 | 2,109 | 2,986 | (3%) | 7,629 | 9,446 | (19%) | ||||||||
| -Electric Energy Generation – Hydro | 1,456 | 1,035 | 951 | 53% | 3,323 | 2,142 | 55% | ||||||||
| -Electric Energy Generation – Wind | 55 | – | – | N/A | 55 | – | N/A | ||||||||
| Installed capacity (MW; EoP1) | 3,810 | 3,663 | 3,791 | 1% | 3,810 | 3,791 | 1% | ||||||||
| -Installed capacity -Thermal (MW) | 2,222 | 2,222 | 2,350 | (5%) | 2,222 | 2,350 | (5%) | ||||||||
| -Installed capacity – Hydro (MW) | 1,441 | 1,441 | 1,441 | 0% | 1,441 | 1,441 | 0% | ||||||||
| -Installed capacity – Wind (MW) | 147 | – | – | N/A | 147 | – | N/A | ||||||||
| Availability – Thermal2 | 94% | 79% | 91% | 2 p.p. | 87% | 89% | (2 p.p.) | ||||||||
| Steam production (thousand Tons) | 286 | 285 | 289 | (1%) | 846 | 888 | (5%) | ||||||||
1 EoP refers to “End of Period”
2 Availability weighted average by power capacity. Off-time due to scheduled maintenance agreed with CAMMESA is not included in the ratio.
Source: CAMMESA; company data.
In 3Q2018, energy generation from continuing operations increased 12% to 4,422 GWh, compared to 3Q2017, mainly because of a 53% increase in hydro generation, which recovered after 2016-2017’s drought, and the start of operations from the wind farms Achiras I and La Castellana I, while thermal production in the period decreased 3%. During 3Q2018, machine availability of thermal units was 94%, compared to 91% in 3Q2017, showing a sustained level and well above the market average availability for thermal units for the same period of 79%, according to data from CAMMESA.
Finally, steam production showed a 1% decrease totaling 286,000 tons produced during 3Q2018 compared to 289,000 tons during the 3Q2017, due to less demand by our client.
In 9M2018, energy generation from continuing operations decreased 5% to 11,007 GWh, compared to 9M2017, affected by a 19% decrease in thermal generation mainly due to scheduled maintenance in the Puerto Combined Cycle Plant during 2Q2018. The temporary impact on thermal production was partially offset by a 55% increase in hydro generation due to greater water flow. During 9M2018, machine availability of thermal units was 87%, compared to 89% in 9M2017, mainly due to the above-mentioned extension (unscheduled) of the maintenance of the Puerto Combined Cycle Plant. Nonetheless, Central Puerto’s availability was higher than the market average of 79% for the same period, according to data from CAMMESA.
Finally, during 9M2018, steam production decreased 5% to 846,000 tons compared to 888,000 during the same period of 2017, due to less demand by our client.
Renewable energy
During 3Q2018, La Castellana I (99MW) and Achiras I (48MW) wind farms commenced their commercial operations. These plants generated and sold, under the RenovAr Program, a total of 55 GWh of electric energy during their first months of operations.
D. Financials
Main financial magnitudes of continuing operations
| Million Ps. | 3Q | 2Q | 3Q | Var % | 9M | 9M | Var | ||||||||||||||||||||||||
| 2018 | 2018 | 2017 | (3Q/3Q) | 2018 | 2017 | % | |||||||||||||||||||||||||
| Revenues | 3,513 | 2,102 | 1,539 | 128% | 7,419 | 4,021 | 84% | ||||||||||||||||||||||||
| Cost of sales | (1,191) | (937) | (652) | 83% | (2,876) | (1,955) | 47% | ||||||||||||||||||||||||
| Gross profit | 2,322 | 1,165 | 887 | 162% | 4,543 | 2,067 | 120% | ||||||||||||||||||||||||
| Administrative and selling expenses | (268) | (255) | (150) | 79% | (726) | (447) | 62% | ||||||||||||||||||||||||
|
Operating income before other operating results |
2,054 | 910 | 738 | 178% | 3,818 | 1,620 | 136% | ||||||||||||||||||||||||
| Other operating results, net1 | 6,630 | 4,651 | 161 | 4,015% | 20,036 | 283 | 6,989% | ||||||||||||||||||||||||
| Operating income | 8,684 | 5,561 | 898 | 867% | 23,854 | 1,902 | 1,154% | ||||||||||||||||||||||||
| Depreciation and Amortization | 123 | 67 | 74 | 62% | 264 | 204 | 25% | ||||||||||||||||||||||||
| Adjusted EBITDA2 | 8,808 | 5,628 | 972 | 804% | 24,118 | 2,106 | 1,041% | ||||||||||||||||||||||||
| 1 Other operating results, net include, among others, the following concepts: | |||||||||||||||||||||||||||||||
|
– | – | – | N/A | 7,959 | – | N/A | ||||||||||||||||||||||||
interests related to FONI trade receivables |
|||||||||||||||||||||||||||||||
| 6,297 | 4,456 | 38 | 16,554% | 10,802 | 79 | 13,564% | |||||||||||||||||||||||||
|
See “CVO effect” below for further information.
2 See “Disclaimer-Adjusted EBITDA” below for further information. |
|||||||||||||||||||||||||||||||
| Average exchange rate of period | 31.96 | 23.58 | 17.29 | 85% | 31.96 | 16.26 | 97% | ||||||||||||||||||||||||
| Exchange rate end of period | 41.25 | 28.85 | 17.31 | 138% | 41.25 | 17.31 | 138% | ||||||||||||||||||||||||
NOTE: Exchange rates quoted by the Banco de la Nación Argentina are provided only as a reference. The average exchange rate is calculated as the average of the daily exchange rates quoted by the Banco de la Nación Argentina for wire transfers (divisas) for the relevant period.
Adjusted EBITDA Reconciliation
|
Million Ps. |
3Q 2018 |
2Q 2018 |
3Q
2017 |
Var % (3Q/3Q) |
9M
2018 |
9M
2017 |
Var %
|
||||||||
| Net income for the period2 | 5,404 | 3,943 | 806 | 571% | 16,849 | 2,079 | 710% | ||||||||
| Financial expenses | 1,993 | 1,142 | 162 | 1,130% | 3,395 | 486 | 599% | ||||||||
| Financial income | (459) | (875) | (124) | 271% | (1,486) | (836) | 78% | ||||||||
| Share of the profit of an associate | (423) | (259) | (131) | 224% | (831) | (223) | 273% | ||||||||
| Income tax expenses | 2,170 | 1,610 | 352 | 516% | 6,457 | 822 | 685% | ||||||||
| Depreciation and amortization | 123 | 67 | 74 | 62% | 264 | 204 | 25% | ||||||||
| Net income of discontinued operations | – | – | (167) | (100%) | (530) | (426) | 25% | ||||||||
| Adjusted EBITDA1,2 | 8,808 | 5,628 | 972 | 805% | 24,118 | 2,106 | 1,042% | ||||||||
| 1 Net income of the period includes, among others, the following Other operating results, net concepts: | |||||||||||||||
|
– | – | – | N/A | 7,959 | – | N/A | ||||||||
|
6,297 | 4,456 | 38 | 16,554% | 10,802 | 79 | 13,564% | ||||||||
|
See “CVO effect” below for further information.
2 See “Disclaimer-Adjusted EBITDA” below for further information. |
|||||||||||||||
3Q2018 Results Analysis
Revenues from continuing operations increased 128% to Ps. 3,513 million in the 3Q2018, as compared to Ps. 1,539 million in 3Q2017. The increase in revenues was mainly driven by (i) the tariff increase established by Res. 19/17, which set higher prices for energy generation and machine availability and set the prices in US dollars (3Q2018 was fully-impacted by the November 2017 tariff increase), (ii) an 85% increase in the average exchange rate of 3Q2018, as compared to the average exchange rate of 3Q2017, which impacted on tariffs set in US dollars, (iii) a 12% increase in energy generation from continuing operations that totaled 4,422 GWh during 3Q2018, as compared to 3,937 during 3Q2017, because of a 53% increase in generation form our hydro plants, and (iv) higher availability from our thermal units, which totaled 94% during 3Q2018.
The table below sets forth the tariff scheme for Energía Base effective since November 2017, by source of generation:
| Thermal | Hydro | ||||
|
Capacity payments Res. 19/171 |
Up to US$ 7,000 per MW per month |
US$ 3,000 per MW per month |
|||
|
Energy payments Res. 19/17 |
US$ 7 per MWh for generation with natural gas
US$ 10 per MWh for generation with fuel oil/gas oil |
US$ 4.9 per MWh | |||
1Effective prices for capacity payment depend on the availability of each unit, and the achievement of the Guaranteed Bid Capacity (DIGO in Spanish) that each generator may send to CAMMESA twice a year. For further details, see “Item 4.B. Business Overview—The Argentine Electric Power Sector—Remuneration Scheme—The Current Remuneration Scheme” in the annual report on Form 20-F filed with the SEC on April 27, 2018.
Operating income before other operating results, net, increased 178% to Ps. 2,054 million, compared to Ps. 738 million in the 3Q2017. This increase was due to (i) the above-mentioned increase in revenues, and (ii) a less-than-proportional increase in costs of sales in 3Q2018 that totaled Ps. 1,191 million, an increase of 82% as compared to Ps. 652 million in 3Q2017. The increase in the cost of sales was primarily driven by (i) an increase in the natural gas transportation and distribution tariffs and (ii) a 85% increase in the average exchange rate of 3Q2018, as compared to the average exchange rate of 3Q2017, which impacted the dollar-denominated price of natural gas and natural gas transportation and distribution tariffs, which was partially offset by (iii) a lower cost of the natural gas used for the units that generate steam and electric energy under the Energía Plus framework. As a consequence, Gross Profit Margin increased 8 p.p., reaching 66% in the 3Q2018. Additionally, the cost of administrative and selling expenses increased 79% totaling Ps. 268 million in 3Q2018 compared to Ps. 150 million in the 3Q2017. This increase was mainly driven by (i) a 93% increase in compensation to employees as a result of x) an increase in the number of employees during the 3Q2018 as compared to the same period of 2017, mainly related to the development of the new thermal and renewable projects and y) salary adjustments agreed in the collective bargaining agreements during the period, and (ii) a 160% increase in taxes on bank account transactions, due to increased revenues, costs and capital investments completed during the period.
Adjusted EBITDA increased to Ps. 8,808 million in 3Q2018, compared to Ps. 974 million in 3Q2017. This exceptionally high increase was driven by: (i) the increase in operating results before other operating income, net mentioned above, (ii) a Ps. 6,297 million gain in the 3Q2018 from the foreign exchange difference and interest accrued on the trade receivables denominated in US dollars, mainly from FONI.
Net income increased to Ps. 5,404 million or Ps. 3.79 per share, in 3Q2018, compared to Ps. 806 million or Ps. 0.53 per share, in 3Q2017. In addition to the above-mentioned factors, net income was (i) negatively impacted by higher financial expenses that amounted to Ps. 1,993 million in 3Q2018, compared to Ps. 162 million in 3Q2017, and (ii) positively impacted by higher financial income which amounted Ps. 459 million during 3Q2018, compared to Ps. 124 million in the 3Q2017, in each case under (i) and (ii), mainly due to the foreign exchange difference over US dollar denominated debt and financial assets (which excludes FONI and other trade receivables). Additionally, results from the share of profit of associates increased to Ps. 423 million in 3Q2018, as compared to Ps. 131 million in 3Q2017, mainly due to higher net income from Ecogas.
FONI collections were Ps. 143 million in 3Q2018, compared to Ps. 90 million in 3Q2017 -both including VAT- (equivalent to approximately US$ 4 million and US$ 5 million, respectively, at the average exchange rate of each period), in both cases associated to the FONI trade receivables for San Martín and Manuel Belgrano Plants. As for the trade receivables associated with the CVO agreement, certain documentation has substantially been finalized by CAMMESA and is ready to be signed by the authorities.
9M2018 Results Analysis
Revenues from continuing operations increased 84% to Ps. 7,419 million in the 9M2018, as compared to Ps. 4,021 million in 9M2017. The increase in revenues was mainly driven by (i) the tariff increase established by Res. 19/17, which set higher prices for energy generation and machine availability and set the prices in US dollars (9M2018 was fully-impacted by the November 2017 tariff increase) and (ii) a 97% increase in the average exchange rate of 9M2018, as compared to the average exchange rate of 9M2017, which impacted tariffs set in US dollars; which was partially offset by a 5% decrease in energy generation from continuing operations that totaled 11,007 GWh during 9M2018, and less availability from our thermal units during 9M2018, mainly because of the scheduled maintenance of the Puerto Combined Cycle Plant.
Operating income before other operating results, net, increased 136% to Ps. 3,818 million, compared to Ps. 1620 million in 9MQ2017. This increase was due to (i) the above-mentioned increase in revenues, and (ii) a less-than-proportional increase in costs of sales that totaled Ps. 2,876 million, a 47% increase as compared to Ps. 1,955 million in 9M2017. The increase in the cost of sales was primarily driven by (i) an increase in the natural gas transportation and distribution tariffs and (ii) a higher cost of natural gas for the units that generate steam or electric energy under the Energía Plus framework, mainly due to a 97% increase in the average exchange rate of 9M2018, as compared to the average exchange rate of 9M2017, which impacted the dollar-denominated price of natural gas. As a consequence, Gross Profit Margin increased 10 p.p., reaching 61% in 9M2018. Additionally, the cost of administrative and selling expenses increased 62% totaling Ps. 726 million in 9M2018 compared to Ps. 447 million in the 9M2017. This increase was mainly driven by (i) a 44% increase in compensation to employees mainly as a result of salary adjustments agreed in the collective bargaining agreements during the period, and (ii) a 60% increase in fees and compensation for professional services due to legal and financial advisory and consultancy services used during the period and (iii) a 190% increase in taxes on bank account transactions, due to increased revenues, costs and capital investments completed during the period.
Adjusted EBITDA increased to Ps. 24,118 million in 9M2018, compared to Ps. 2,113 million in 9M2017. This exceptionally high increase was driven by (i) the increase in operating results before other operating income, net mentioned above; (ii) a Ps. 7,959 million during the 9M2018 from a one-time-gain from the CVO Commercial Operation Approval (the “CVO effect”) and (iii) Ps. 11,504 million during the 9M2018 from the foreign exchange difference and interest accrued on the trade receivables denominated in US dollars, mainly from FONI trade receivables.
Net income increased to Ps. 16,849 million or Ps. 11.53 per share, in 9M2018, compared to Ps. 2,079 million or Ps. 1.37 per share, in 9M2017. In addition to the above-mentioned factors, net income was (i) was negatively impacted by higher financial expenses that amounted to Ps. 3,395 million in 9M2018, compared to Ps. 486 million in 9M2017, and (ii) positively impacted by higher financial income which amounted to Ps. 1,486 million during 9M2018, compared to Ps. 836 million in 9M2017, in each case under (i) and (ii), mainly due to the foreign exchange difference over US dollar denominated debt and financial assets (which excludes FONI and other trade receivables). Additionally, results from the share of profit of associates increased to Ps. 831 million in 9M2018, as compared to Ps. 223 million in 9M2017, mainly due to higher net income from Ecogas and TGM.
FONI collections increased to Ps. 349 million in 9M2018, compared to Ps. 258 million in 9M2017 -both including VAT- (equivalent to approximately US$ 15 million and US$ 16 million, respectively, at the average exchange rate of each period), in both cases associated to the FONI trade receivables for San Martín and Manuel Belgrano Plants. As for the trade receivables associated with the CVO agreement, certain documentation has substantially been finalized by CAMMESA and is ready to be signed by the authorities.
Financial Situation
As of September 30, 2018, the Company and its subsidiaries showed a strong balance sheet with Cash and Cash Equivalents of Ps. 826 million, and Current Financial Assets of Ps. 917 million.
Loans and borrowings totaling Ps. 6,716 million were received mainly by Central Puerto’s subsidiaries CP Achiras and CP La Castellana, to finance the construction of La Castellana I and Achiras I wind farms. From these, Ps. 920 million were current (due date of less than one year), and Ps. 5,796 million were non-current. The IFC-IIC facilities have to be repaid in 52 quarterly equal installments starting in February 2019 in the case of CP La Castellana, and May 2019, in the case of CP Achiras.
| Million Ps. | As of
September 30, 2018 |
||||
| Cash and cash equivalents | 484 | ||||
| Other financial assets | 880 | ||||
| Financial Debt | 0 | ||||
| Subtotal Individual Net Cash Position | 1,364 | ||||
| Cash and cash equivalents of subsidiaries | 342 | ||||
| Other financial assets of subsidiaries | 37 | ||||
| Financial Debt of subsidiaries
Composed of: |
(6,716) | ||||
| Financial Debt of subsidiaries (current) | (920) | ||||
| Financial Debt of subsidiaries (non-current) | (5,796) | ||||
| Subtotal Subsidiaries Net Cash Position | (6,336) | ||||
| Consolidated Net Cash Position | (4,972) | ||||
Cash Flows for 9M2018
| Million Ps. | 9M2018
Ended September 30, 2018 |
|
| Cash and Cash equivalents at the beginning | 89 | |
| Net cash flows provided by operating activities | 1506 | |
| Net cash flows used in investing activities | (2,217) | |
| Net cash flows provided by financing activities | 314 | |
| Exchange difference and other financial results | 1135 | |
| Cash and Cash equivalents at the end | 826 | |
Net cash provided by operating activities was Ps. 1,505 million during 9M2018. This cash flow arises from Ps. 23,343 million from the operating income from continuing operations obtained during the 9M2018, minus the non-cash items included in it, which were mainly: (i) Ps. 7,959 million from the one-time CVO receivables update and interest, (ii) Ps. 10,654 million from trade receivables foreign exchange difference, (iii) Ps. 520 million from the discount of accounts receivables and payable, net, mainly from the present value of accounting provision for the income tax, payable in May 2019 and (iv) Ps. 1,986 million from income tax paid.
Net cash used in investing activities was Ps. 2,217 million in 9M2018. This amount was mainly due to (i) payments that amounted to Ps. 3,909 million for the purchase of property, plant and equipment for the construction of Achiras I and La Castellana I wind farms, and thermal cogeneration units Terminal 6 and Luján de Cuyo. This was partially offset by partially offset by (i) Ps. 435 million obtained by the sale of short-term financial assets, net, (ii) Ps. 669 million from proceeds from dividends from associates, mentioned above and (iii) Ps. 587 million from the proceeds of the La Plata Plant Sale.
Net cash provided by financing activities was Ps. 314 million in 9M2018. The main financing activities during 9M2018 were the above-mentioned long-term loans received by CP Achiras and CP La Castellana, for the construction of the Achiras I and La Castellana I wind farms for a net amount of Ps. 1,411 million, after deducting the repayment of long term loans during 9M2018, which was partially offset by (i) Ps. 1,054 million in cash dividend distributed to Central Puerto’s stockholders, and (ii) Ps. 322 million paid in interest and financial expenses.
E. Tables
a. Consolidated Income Statement
| 9M2018 | 9M2017 | ||||||
| Thousand Ps. | Thousand Ps. | ||||||
| Revenues | 7,419,288 | 4,021,380 | |||||
| Cost of sales | (2,876,055) | (1,954,777) | |||||
| Gross income | 4,543,233 | 2,066,603 | |||||
| Administrative and selling expenses | (725,602) | (446,999) | |||||
| Other operating income | 12,152,357 | 318,218 | |||||
|
Other operating expenses CVO receivables update and interests |
(74,718) | (35,575)
– |
|||||
| 7,958,658 | |||||||
| Operating income | 23,853,928 | 1,902,247 | |||||
| Finance Income | 1,458,523 | 835,800 | |||||
| Finance Expenses | (3,394,618) | (485,673) | |||||
| Share of the profit of associates | 830,691 | 222,915 | |||||
|
Income before income tax form continuing operations |
22,775,524 | 2,475,289 | |||||
| Income tax for the period | (6,456,817) | (822,262) | |||||
|
Net income for the period from continuing operations |
16,318,707 | 1,653,027 | |||||
|
DISCONTINUED OPERATIONS |
|||||||
|
Net income for the period from non-continuing operations |
530,489 | 426,062 | |||||
| Net income for the period | 16,849,196 | 2,079,089 | |||||
| 3Q2018 | 2Q2018 | 3Q2017 | ||||||||
| Thousand Ps. | Thousand Ps. | Thousand Ps. | ||||||||
| Revenues | 3,513,311 | 2,101,825 | 1,539,456 | |||||||
| Cost of sales | (1,191,262) | (936,735) | (652,165) | |||||||
| Gross income | 2,322,049 | 1,165,090 | 887,291 | |||||||
| Administrative and selling expenses | (268,188) | (255,210) | (149,764) | |||||||
| Other operating income | 6,661,153 | 4,676,293 | 177,221 | |||||||
| Other operating expenses | (30,707) | (25,653) | (16,630) | |||||||
| CVO receivables update and interests | – | – | – | |||||||
| Operating income | 8,684,307 | 5,560,520 | 898,118 | |||||||
| Finance Income | 459,458 | 875,360 | 123,803 | |||||||
| Finance Expenses | (1,992,971) | (1,141,801) | (161,983) | |||||||
| Share of the profit of associates | 423,333 | 259,297 | 130,722 | |||||||
| Income before income tax form continuing | ||||||||||
| operations | 7,574,127 | 5,553,376 | 990,660 | |||||||
| Income tax for the period | (2,169,645) | (1,610,330) | (352,034) | |||||||
| Net income for the period from continuing | ||||||||||
| operations | 5,404,482 | 3,943,046 | 638,626 | |||||||
|
DISCONTINUED OPERATIONS |
||||||||||
| Net income for the period from non-continuing | ||||||||||
| operations | – | – | 166,986 | |||||||
| Net income for the period | 5,404,482 | 3,943,046 | 805,612 | |||||||
b. Consolidated Statement of Financial Position
|
As of September 30, 2018 |
As of December 31, 2017 |
||||||||
| Thousand Ps. | Thousand Ps. | ||||||||
| Assets | |||||||||
| Non-current assets | |||||||||
| Property, plant and equipment | 11,699,684 | 7,431,728 | |||||||
| Intangible assets | 579,395 | 187,833 | |||||||
| Investment in associates | 1,147,042 | 985,646 | |||||||
| Trade and other receivables | 18,690,258 | 2,602,213 | |||||||
| Other non-financial assets | 242,523 | 12,721 | |||||||
| Inventories | 48,203 | 48,203 | |||||||
| Other financial assets | 44,745 | – | |||||||
| 32,451,850 | 11,268,344 | ||||||||
| Current assets | |||||||||
| Inventories | 166,942 | 110,290 | |||||||
| Other non-financial assets | 705,062 | 470,895 | |||||||
| Trade and other receivables | 9,192,004 | 3,887,065 | |||||||
| Other financial assets | 917,457 | 1,110,728 | |||||||
| Cash and cash equivalents | 826,231 | 88,633 | |||||||
| 11,807,696 | 5,667,611 | ||||||||
| Assets held-for-sale | – | 143,014 | |||||||
| 11,807,696 | 5,810,625 | ||||||||
| Total assets | 44,259,546 | 17,078,969 | |||||||
| Equity and liabilities | |||||||||
| Capital stock | 1,514,022 | 1,514,022 | |||||||
| Adjustment to capital stock | 664,988 | 664,988 | |||||||
| Merger premium | 376,571 | 376,571 | |||||||
| Legal and other reserves | 668,813 | 519,189 | |||||||
| Voluntary reserve | 2,744,471 | 450,865 | |||||||
| Retained earnings | 17,366,464 | 3,503,046 | |||||||
| Accumulated other comprehensive income | – | 43,284 | |||||||
| Equity attributable to shareholders of the parent | 23,335,329 | 7,071,965 | |||||||
| Non-controlling interests | 36,417 | 289,035 | |||||||
| Total Equity | 23,371,746 | 7,361,000 | |||||||
| Non-current liabilities | |||||||||
| Other non-financial liabilities | 2,208,002 | 468,695 | |||||||
| Other loans and borrowings | 5,795,825 | 1,478,729 | |||||||
| Borrowings from CAMMESA | 933,527 | 1,055,558 | |||||||
| Compensation and employee benefits liabilities | 117,015 | 113,097 | |||||||
| Deferred income tax liabilities | 1,719,879 | 703,744 | |||||||
| 10,744,248 | 3,819,823 | ||||||||
| Current liabilities | |||||||||
| Trade and other payables | 1,209,328 | 1,017,306 | |||||||
| Borrowings from CAMMESA | 1,820,826 | 1,753,038 | |||||||
| Other non-financial liabilities | 1,313,420 | 659,668 | |||||||
| Other loans and borrowings | 919,708 | 505,604 | |||||||
| Compensation and employee benefits liabilities | 337,716 | 323,078 | |||||||
| Income tax payable | 4,040,635 | 1,096,817 | |||||||
| Provisions | 471,919 | 413,474 | |||||||
| 10,113,552 | 5,768,985 | ||||||||
| Liabilities associated with the assets held for sale | – | 129,161 | |||||||
| 10,113,552 | 5,898,146 | ||||||||
| Total liabilities | 20,887,800 | 9,717,969 | |||||||
| Total equity and liabilities | 44,259,546 | 17,078,969 | |||||||
c. Consolidated Statement of Cash Flow
| 9M2018 | 9M2017 | ||||||
| Thousand Ps. | Thousand Ps. | ||||||
| Operating activities | |||||||
|
Income for the period before income tax from continuing operations |
22,775,524 | 2,475,289 | |||||
|
Income for the period before income tax from discontinued operations |
567,628 | 655,481 | |||||
| Income for the period before income tax | 23,343,152 | 3,130,770 | |||||
| Adjustments to reconcile income for the period before | |||||||
| income tax to net cash flows: | |||||||
| Depreciation of property, plant and equipment | 237,840 | 181,468 | |||||
| Disposal of property, plant and equipment | 30,917 | 411 | |||||
| Amortization of intangible assets | 26,336 | 29,614 | |||||
| Discount of accounts receivable and payable, net | (519,971) | (17,598) | |||||
| CVO receivables update and interests | (7,958,658) | – | |||||
| Interest earned from customers | (850,489) | (155,942) | |||||
| Financial income | (1,485,523) | (835,800) | |||||
| Financial expenses | 3,394,618 | 485,927 | |||||
| Share of the profit of associates | (830,690) | (222,915) | |||||
| Stock-based payments | 3,312 | – | |||||
|
Movements in provisions and long-term employee benefit plan expenses |
81,990 | 57,873 | |||||
| Trade receivables foreign Exchange difference | (10,653,625) | – | |||||
| Income from the sale of La Plata plant | (572,992) | – | |||||
| Working capital adjustments: | |||||||
| Increase in trade and other receivables | (2,573,032) | (658,707) | |||||
|
Decrease (Increase) in other non-financial assets and inventories |
(520,621) | (28,602) | |||||
| Increase in trade and other payables, other non- | |||||||
| financial liabilities and liabilities from employee | |||||||
| benefits | 2,314,360 | 235,807 | |||||
| 3,466,923 | 2,202,306 | ||||||
| Interest received from customers | 24,692 | 16,451 | |||||
| Income tax paid | (1,985,880) | (574,684) | |||||
| Net cash flows provided by operating activities | 1,505,735 | 1,644,073 | |||||
| Investing activities | |||||||
| Purchase of property, plant and equipment | (3,908,715) | (1,034,693) | |||||
| Sale of financial assets, net | 435,437 | 1,183,627 | |||||
| Dividends received | 669,348 | 36,372 | |||||
| Cash flows generated from the sale of La Plata plant | 586,845 | – | |||||
| Others | – | (6) | |||||
| Net cash flows provided by investing activities | (2,217,085) | 185,300 | |||||
| Financing activities | |||||||
| Short term loans (settlements) proceeds, net | 23,737 | (191,817) | |||||
| Long term loans received | 3,188,944 | – | |||||
| Long term loans paid | (1,778,260) | – | |||||
| Interests and other loan costs paid | (322,119) | (42,758) | |||||
| Dividends paid | (1,053,620) | (1,279,393) | |||||
| Loans cancelled | – | (994,966) | |||||
| Borrowings received from CAMMESA | – | 403,427 | |||||
| Contributions from non-controlling interests | 255,142 | 266,913 | |||||
| Net cash flows provided (used in) by financing activities | 313,824 | (1,838,594) | |||||
| Net increase in cash and cash equivalents | (397,526) | (9,221) | |||||
| Exchange difference and other financial results | 1,135,124 | 2,088 | |||||
| Cash and cash equivalents as of January 1 | 88,633 | 30,008 | |||||
| Cash and cash equivalents as of September 30 | 826,231 | 22,875 |
F. Information about the Conference Call
There will be a conference call to discuss Central Puerto’s third quarter 2018 results on Tuesday November 13, 2018 at 12:00 p.m. New York Time / 14:00 Buenos Aires Time.
The hosts will be Mr. Jorge Rauber, Chief Executive Officer, and Mr. Fernando Bonnet, Chief Financial Officer. To access the conference call, please dial:
United States Participants (Toll Free): +1-888-317-6003
Argentina Participants (Toll Free): 0800-555-0645
International Participants: +1-412-317-6061
Passcode: 3360702
The Company will also host a live audio webcast of the conference call on the Investor Relations section of the Company’s website at http://investors.centralpuerto.com/. Please allow extra time prior to the call to visit the website and download any streaming media software that might be required to listen to the webcast.
You may find additional information on the Company at:
- http://investors.centralpuerto.com/
- www.cnv.gob.ar
- www.sec.gov
Glossary
In this release, except where otherwise indicated or where the context otherwise requires:
- “CAMMESA” refers to Compañía Administradora del Mercado Mayorista Eléctrico Sociedad Anónima;
- “CVP” refers to Variable Cost of Production of producing energy, which may be declared by the generation companies to CAMMESA;
- “CVO effect” refers to the CVO receivables update and interests triggered by the CVO Plant Commercial Operation Approval, which generated a Ps. 7,959 million one-time-gain accrued during the 1Q2018;
- “Ecogas” refers collectively to Distribuidora de Gas Cuyana (“DGCU”), and its controlling company Inversora de Gas Cuyana (“IGCU”) and Distribuidora de Gas del Centro (“DGCE”), and its controlling company Inversora de Gas del Centro (“IGCE”);
- “Energía Base” (legacy energy) refers to the regulatory framework established under Resolution SE No. 95/13, as amended, and, since February 2017, regulated by Resolution SEE No. 19/17;
- “FONINVEMEM” or “FONI”, refers to the Fondo para Inversiones Necesarias que Permitan Incrementar la Oferta de Energía Eléctrica en el Mercado Eléctrico Mayorista (the Fund for Investments Required to Increase the Electric Power Supply) and Similar Programs, including Central Vuelta de Obligado (CVO) Agreement;
- “MATER”, refers to Mercado a Término de Energía Renovable, is the regulatory framework that allows generators to sell electric energy from renewable sources directly to large users.
- “p.p.”, referes to percentage points;
- “TGM” refers to Transportadora de Gas del Mercosur S.A.;
Disclaimer
Rounding amounts and percentages: Certain amounts and percentages included in this release have been rounded for ease of presentation. Percentage figures included in this release have not in all cases been calculated on the basis of such rounded figures, but on the basis of such amounts prior to rounding. For this reason, certain percentage amounts in this release may vary from those obtained by performing the same calculations using the figures in the financial statements. In addition, certain other amounts that appear in this release may not sum due to rounding.
This release contains certain metrics, including information per share, operating information, and others, which do not have standardized meanings or standard methods of calculation and therefore such measures may not be comparable to similar measures used by other companies. Such metrics have been included herein to provide readers with additional measures to evaluate the Company’s performance; however, such measures are not reliable indicators of the future performance of the Company and future performance may not compare to the performance in previous periods.
OTHER INFORMATION
Central Puerto routinely posts important information for investors in the Investor Relations support section on its website, www.centralpuerto.com. From time to time, Central Puerto may use its website as a channel of distribution of material Company information. Accordingly, investors should monitor Central Puerto’s Investor Support website, in addition to following the Company’s press releases, SEC filings, public conference calls and webcasts. The information contained on, or that may be accessed through, the Company’s website is not incorporated by reference into, and is not a part of, this release.
CAUTIONARY STATEMENTS RELEVANT TO FORWARD-LOOKING INFORMATION
This release contains certain forward-looking information and forward-looking statements as defined in applicable securities laws (collectively referred to in this Earnings Release as “forward-looking statements”) that constitute forward-looking statements. All statements other than statements of historical fact are forward-looking statements. The words ‘‘anticipate,’’ ‘‘believe,’’ ‘‘could,’’ ‘‘expect,’’ ‘‘should,’’ ‘‘plan,’’ ‘‘intend,’’ ‘‘will,’’ ‘‘estimate’’ and ‘‘potential,’’ and similar expressions, as they relate to the Company, are intended to identify forward-looking statements.
Statements regarding possible or assumed future results of operations, business strategies, financing plans, competitive position, industry environment, potential growth opportunities, the effects of future regulation and the effects of competition, expected power generation and capital expenditures plan, are examples of forward-looking statements. Forward-looking statements are necessarily based upon a number of factors and assumptions that, while considered reasonable by management, are inherently subject to significant business, economic and competitive uncertainties and contingencies, which may cause the actual results, performance or achievements of the Company to be materially different from any future results, performance or achievements expressed or implied by the forward-looking statements.
The Company assumes no obligation to update forward-looking statements except as required under securities laws. Further information concerning risks and uncertainties associated with these forward-looking statements and the Company’s business can be found in the Company’s public disclosures filed on EDGAR (www.sec.gov).
Adjusted EBITDA
In this release, Adjusted EBITDA, a non-IFRS financial measure, is defined as net income for the year, plus finance expenses, minus finance income, minus share of the profit of associates, minus depreciation and amortization, plus income tax expense, plusdepreciation and amortization, minus net results of discontinued operations.
Adjusted EBITDA is believed to provide useful supplemental information to investors about the Company and its results. Adjusted EBITDA is among the measures used by the Company’s management team to evaluate the financial and operating performance and make day-to-day financial and operating decisions. In addition, Adjusted EBITDA is frequently used by securities analysts, investors and other parties to evaluate companies in the industry. Adjusted EBITDA is believed to be helpful to investors because it provides additional information about trends in the core operating performance prior to considering the impact of capital structure, depreciation, amortization and taxation on the results.
Adjusted EBITDA should not be considered in isolation or as a substitute for other measures of financial performance reported in accordance with IFRS. Adjusted EBITDA has limitations as an analytical tool, including:
• Adjusted EBITDA does not reflect changes in, including cash requirements for, our working capital needs or contractual commitments;
• Adjusted EBITDA does not reflect our finance expenses, or the cash requirements to service interest or principal payments on our indebtedness, or interest income or other finance income;
• Adjusted EBITDA does not reflect our income tax expense or the cash requirements to pay our income taxes;
• although depreciation and amortization are non-cash charges, the assets being depreciated or amortized often will need to be replaced in the future, and Adjusted EBITDA does not reflect any cash requirements for these replacements;
• although share of the profit of associates is a non-cash charge, Adjusted EBITDA does not consider the potential collection of dividends; and
• other companies may calculate Adjusted EBITDA differently, limiting its usefulness as a comparative measure.
The Company compensates for the inherent limitations associated with using Adjusted EBITDA through disclosure of these limitations, presentation of the Company’s consolidated financial statements in accordance with IFRS and reconciliation of Adjusted EBITDA to the most directly comparable IFRS measure, net income. For a reconciliation of the net income to Adjusted EBITDA, see the tables included in this release.