Reducing Failure Components In Solar Tracking
On April 20, 2010, a single device called a blowout preventer led to one of the worst environmental and financial disasters ever recorded. The BOP failed to seal a well shut after the explosion on the Deepwater Horizon oil rig, resulting in 11 deaths and millions of gallons of oil flowing into the Gulf of Mexico over 87 days before the well could be capped. Although the solar industry fortunately does not have the same exposure to the dramatic consequences of a BOP problem, the failure of devices in a large utility-scale solar field can lead to crippling operations and maintenance (O&M) costs or even outright economic impairment if poor technology choices are made. Fortunately, the solar industry can turn to risk analysis techniques applied in analogous situations, such as the “N-1” approach for analyzing catastrophic failure risk and a straightforward “failure rate” approach for assessing long-term O&M costs.
Given that tracker systems literally form the very foundations of utility-scale solar projects, applying these techniques to that equipment can greatly impact the overall long-term reliability and performance of such solar plants.
The need for long-term reliability
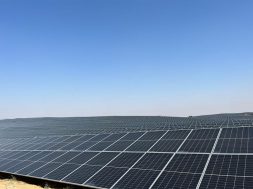
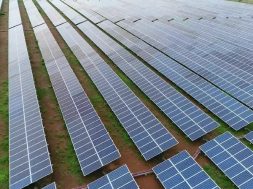
The geographic footprint and number of devices in a utility-scale project can be staggering. A typical 100 MW site can require over 300,000 solar panels. Each solar panel, if vertically mounted side-by-side, occupies about 40 inches of width (over 3 feet) – meaning a 100 MW solar field can have nearly 200 miles of racking! With solar trackers now commonly used in these large projects in order to boost production and match energy demand curves, the solar plant owner has to maintain numerous electronic and electromechanical devices, such as motors, controllers and sensors, and all of them represent potential maintenance and failure points spread out over hundreds of linear miles. Depending on the tracker technology selected, the number of these electronic and electromechanical components can range from a couple hundred to tens of thousands.
Not only do these devices need to operate reliably in normal conditions, but they must also be designed to ensure survivability in extreme events, such as high winds or snow loads. Owners of such a facility face a delicate balancing act of driving a low upfront cost for the project while ensuring O&M costs are in check and there is no practical exposure to catastrophic events. Because solar trackers all do the same function – move solar panels east to west during the day in concert with the sun – it can appear to the untrained eye that all trackers are similar, with little or no differentiation. This is not the case, though, as there are three distinct types of tracker technologies available on the market today, and each can have dramatic implications on both upfront costs and long-term O&M costs.
Rotating linked row: In this design, rows of modules are linked with a rotating driveline, which could lead to high terrain flexibility and a large reduction in the number of components needed to track the sun and survive extreme events, such as high winds. Some designs have fewer than 200 electronic and electromechanical components per 100 MW project site and do not rely on wind stow for survival. As an example, a single 2 hp motor can drive approximately 2,520 solar panels. One potential disadvantage of this approach is that a driveline impedes the area between rows for mowing and module cleaning with tractors. However, some standard practices in the solar industry – such as manual panel cleaning, robotic panel cleaning and above-ground wire management, where row traversal is impeded regardless of tracker design – make this a non-issue for many modern utility-scale solar plants.
Push pull: Think of these designs as “shutter blinds,” where a single actuator “pushes and pulls” rows of panels by means of a lateral linear motion drive shaft. Although relatively straightforward in design, these devices normally require flat terrains for perfect alignment of the drive shaft, and because all the force is transferred through the “center rod,” hefty equipment may be required to move the panels and also to withstand high loads, such as wind events. For similar reasons, a single large actuator may only be capable of driving 800-1,700 panels. These systems tend to be material-heavy due to their design architecture. Recently, in an effort to compete in the market, push-pull manufacturers have lightened the structure and employed active wind stow to compensate for the lighter structure. Although push-pull trackers may suffer from inflexibility and range of motion limitations, the good news is that the number of electronic and electromechanical components is limited to approximately 1,000 per 100 MW project site.
Independent row: True to its name, this design “self contains” each row of panels and removes the row-to-row connection element. This may free up movement between rows for routine maintenance, such as module cleaning with tractors or vegetation management if cabling is placed below ground instead of strung between tracker rows. Typically, the row can drive up to 90 standard modules, but each row must have its own motor, controller and other sensory devices to track the sun. This design often comes with an option to either wire the motor to an AC supply or have a battery-driven operation in which the battery is charged by a solar panel. Because each row is self-contained, this design can lead to up to 30,000 electronic and electromechanical components in a 100 MW project site. Although a “wired” solution might afford more reliable day-to-day and stow operation, the additional wiring could also increase install costs, and the system might be exposed to a larger number of failures in a lightning event, which can lead to system-wide failures should each row’s motor or controller be destroyed in a strike.
The “N-1” approach
Deepwater Horizon fell into one of the most common traps of failing to adequately analyze both the economics and needed maintenance programs to ensure the safe operation of a long-lived asset. A foretelling 2003 technical paper assessed the very conundrum facing oil rig owners of balancing the risk of failure of a BOP against the costs of maintaining and testing the device. That paper provides interesting approaches for how to analyze the failure rates at a component level in order to develop a comprehensive maintenance strategy for the BOP. Unfortunately, the advice in that paper was not taken to heart in the Deepwater case.
One approach for looking at survivability in extreme events is an N-1 analysis, which is commonly used in the utility industry for ensuring power system reliability. In this approach, no single event such as a power plant outage will, in turn, lead to a catastrophic result such as a system-wide blackout. This technique can similarly be applied to a utility-scale solar facility by asking very basic, but important, questions. Does the failure of a device such as a motor, battery or controller during an extreme event lead to potential system-wide failure? If so, what are the “backup” plans or remedies in such a scenario?
Occasionally, there is only one last line of defense, which must work when called upon to act. In the oil rig case, that was the BOP device. The owner needs a well-thought-out maintenance and testing program for such a device, or, as in the Deepwater case, the owner subjects itself to enormous risk. This risk can easily be overlooked, as a last-defense device, such as the BOP, is rarely “exercised” because its only function occurs in an extremely rare event, such as a well explosion. For solar trackers, there are similar issues to confront – is the tracker required to be in a certain position (known as “stow”) in order to survive a wind event or a snowstorm? If so, how can that stow action be 100% ensured? Using an N-1 approach can help an owner truly understand its risk exposure and required investments to minimize exposure to such extreme events.
Stowing is such an important issue in some tracker designs that it is worthy of further explanation. Think of a row of panels as a wing or a kite, and you can imagine how wind might interact with them. As winds increase, so do the forces on the panels, which in turn are transferred throughout the racking and tracking system. In an effort to cut costs by “thinning” steel, many tracker manufacturers require that the panels be placed in a flat (or stow) position to survive wind speeds generally over 60 mph. In other words, if the panel is in any position other than flat and experiences a wind speed exceeding 60 mph, the tracker can rip apart and result in catastrophic failures. Other manufacturers do not “thin steel” and, therefore, design their trackers to survive wind events with the solar panels positioned in any orientation.
The need to stow or not in a wind event could lead to a significant impact on proactive maintenance required. A tracker that needs to stow typically requires anemometers to detect wind speed, inclinometers to detect the angle of the panels, and control systems and a secured power source to operate properly. In the case of a battery-driven system requiring stow, one must ask what the backup is if the battery fails. A break in the linkage of sensitive measurement devices and controls has the potential to lead to catastrophic results.
The “failure rate” approach
We’ve all done it: bought the cheapest tool available only to find we got what we paid for – a maintenance nightmare or an outright early failure of the tool. A 100 MW solar project could represent over $100 million in upfront costs, so owners rightfully want to drive that cost down as low as possible. Blind spots can emerge, however, where the bright light of the “cheapest” equipment casts a shadow on the total long-term cost of owning that equipment, which is easily forgotten. A failure rate analysis can be useful to quantify the possible long-term ownership cost of equipment. Take, for example, a tracker design for which one equipment supplier (“Motor A”) uses a single motor to do the job, while another tracker supplier (“Motor B”) uses 30 smaller motors to achieve the same functionality. In this example, assume the motors from each supplier are of identical reliability, with a 1% probability of failure in any given year. Motor A’s part cost is $600, and Motor B’s part cost is $100, meaning the 30 smaller motors when added up would cost $3,000.
There is one additional major differentiator in this example – it can cost similar amounts to send a truck and person to a solar site to replace a Motor A or Motor B failure. Because there are more motors in Motor B’s system, the instance of needing to send repair personnel to the project site is also higher. Doing a straightforward calculation of multiplying the motor’s failure rate by its cost and the number of motors required and then further multiplying by the labor cost reveals the expected annual average maintenance cost for Motor B is 650% (6.5 times) higher compared with Motor A. If Motor B’s design is of commercial quality (with a 2% annual failure rate) and Motor A’s design is of industrial quality (1% annual failure rate), the difference becomes even starker, with Motor B now costing 1,400% (14 times) more than Motor A’s design to maintain. As you can see in the chart below, this becomes a numbers game, and if one tracker design uses significantly more components that require maintenance and periodic replacement, the operational costs increase exponentially. Additionally, continuous equipment malfunctions will surely impact power plant production, as well as expose these stowed tracker systems to more severe consequences.
Summary
Through straightforward analysis techniques and asking hard questions about survivability in extreme events, a solar project owner can avoid the pitfalls that have occurred in many industries when making equipment choices and developing O&M cost projections. This is especially true for long-lived assets such as solar trackers put out in remote harsh weather environments – where what can happen almost certainly will happen over 30+ years of operation. When rigorous analysis is done, we normally find old adages turn out to be true.
Simplicity, quality and preparedness are your best insurance policies for ensuring the financial health of your utility-scale solar project.


