ReneSola Provides Business Update and Announces Second Quarter 2017 Results
–Transaction to Transform Company into Pure Play Downstream Player–
— Company also Reports Second Quarter 2017 Results–
SHANGHAI, Sept. 27, 2017 — ReneSola Ltd (“ReneSola” or the “Company”) (www.renesola.com) (NYSE: SOL), a leading fully-integrated solar project developer and provider of energy efficient products, today provides a business update and announces its unaudited second quarter 2017 results.
As announced on September 25, the Company has entered into a definitive share repurchase and subscription agreement (the “SPA”) with Mr. Xianshou Li, the Company’s Chairman and Chief Executive Officer (the “Buyer”) for the sale of the Company’s manufacturing (including polysilicon, solar wafer, solar cell and solar module manufacturing) and LED distribution businesses (the “Acquired Businesses”). The transaction will also transfer substantially all of ReneSola’s related indebtedness to Li. The transaction will result in:
i) The Company will no longer be liable for the bank borrowings in excess of RMB 3 billion, and the Buyer and his spouse will continue to provide personal guarantees for a majority of such bank’s borrowings;
ii) The acquired businesses will cancel approximately $217.3 million of intercompany payables owed to it by the Company; and
iii) The Company will issue 180 million ordinary shares to ReneSola Singapore Pte. Ltd., an entity to be fully owned by the Buyer upon completion.
Mr. Li commented, “This transaction completes the strategic transformation that was initiated in 2015. We will exit the manufacturing business, which has been impaired by overcapacity, pricing pressure and low profitability, and will become a pure play in the rapidly growing and profitable project development market. We believe this is the best path forward for ReneSola. The losses and a weakened balance sheet of the manufacturing business have been significant constraints on the growth of our downstream business. I am very excited to see ReneSola start anew with a stronger balance sheet, a highly capable team and significant growth opportunities. This transaction represents the beginning of a new chapter for ReneSola.”
This transaction will significantly improve the Company’s balance sheet, providing the financial flexibility necessary to drive the growth of the Company’s project development business. The table below summarizes the pro forma changes in the Company’s balance sheet, based on the terms of the transaction when it is completed.
| All amounts, other than percentages, are in millions of US$ |
Post- Transaction
June 30, 2017 |
Pre-Transaction
June 30, 2017 |
| Total Asset | 250.0 | 1,154.9 |
| Total Liabilities | 169.5 | 1,140.2 |
| —-Bank Borrowings | 33.5 | 701.7 |
| Total Equity | 80.5 | 14.7 |
| Debt-Asset Ratio | 67.8% | 98.7% |
The table below outlines the key benefits that ReneSola expects to derive from this transaction.
| Key Benefits | Details |
| Low Leverage | Eliminate over RMB 3 billion of bank debt |
| Debt-asset ratio of 68% down from 98.7% as of June 30, 2017 |
|
| Lower Management & Financial Costs | Management costs are expected to drop from $46 million to $12 million per year |
| Financial costs to further decrease | |
| Enhanced Financing Ability for Projects | Lower corporate leverage improves project bankability |
| Healthy balance sheet enables the Company to lower financing cost and achieve attractive IRR for projects |
|
| Restore Investor Confidence | Operate growing project business with proven track record |
| Spin-off indebted manufacturing business | |
| Solid global project pipeline to ensure future growth |
|
| Strategic Success | Completes multi-year transition to downstream business |
Project Development Strategy
Since entering the project development business, ReneSola has developed over 480 MW of projects around the world. These projects range from utility scale to smaller rooftop distributed generation. They share the common traits of operating in stable, mature markets with attractive subsidies. The Company believes that its strong track record in solar project development will enable it to accelerate the development of its project pipeline, as well as attract project financing on favorable terms.
While Build-Transfer continues to be an important strategy for the foreseeable future, ReneSola also intends to retain more projects in selected regions and become an independent power producer (“IPP”). The IPP model is especially attractive, due to the resulting high margin recurring revenue. Over time, the Company intends to shift a meaningful amount of its revenue to recurring power sales.
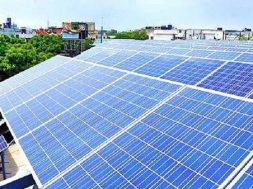
The Company believes the China rooftop solar market is an especially lucrative opportunity and has aggressively established its presence in that market. Rooftop projects can provide steady cash flow, double-digit IRRs, and reduced risk of curtailment or subsidy delays. ReneSola currently owns over 130 MW of rooftop projects under development, concentrated in a handful of eastern provinces of China with attractive development environments. The Company anticipates to own 150 MW of China’s rooftop projects by the end of 2017.
| Operating Assets | Capacity (MW) |
| China DG | 131.2 |
| -Zhejiang | 33.3 |
| -Anhui | 28.8 |
| -Henan | 57.9 |
| -Jiangsu | 5.7 |
| -Shandong | 5.5 |
| Romania | 15.4 |
Mr. Li further commented, “We have demonstrated our ability to successfully build and transfer solar power projects globally. Our project development team consists of 314 dedicated employees around the world. Our strong and capable team, extensive financing relationships and track record of success give us high confidence that we can profitably grow the ‘new’ ReneSola.”
The following table sets forth the Company’s late-stage project pipeline by location:
| Project Location | Shovel-ready (MW) |
| USA | 151.8 |
| UK | 4.3 |
| Japan | 17.5 |
| Canada | 8.6 |
| Turkey | 133.0[1] |
| France | 0.3 |
| Poland | 55.0 |
| Thailand | 5.0 |
| China DG | 104.5 |
| Total | 480.0 |
[1] With the start of operation, ReneSola holds 50% of the economics in the projects, which are held for sale and expected to be sold in the normal course upon connection or shortly thereafter.
As of September 10, 2017, the Company had a pipeline of over 1 GW of projects in various stages, of which 480 MW are projects that are “shovel-ready”. The shovel-ready projects include (i) oversea projects that ReneSola has the right to develop or has self-originated in that ReneSola has obtained definitive agreement, and (ii) projects in China that are either owned by ReneSola and have been filed with PRC National Development and Reform Commission, or third-party projects to which the Company has signed definitive agreements for EPC services. The Company has identified a number of opportunities in China’s domestic distributed generation market, and had 104.5 MW of such projects in the shovel-ready stage as of September 10, 2017.
Outlook
For the third quarter of 2017, the Company’s project business is expected to generate revenue in the range of $40 to $45 million and overall gross margin in the range of 15% to 20% with the gross margin of IPP business in the range of 65%-70%. The Company expects to connect 20 to 30 MW of projects during the third quarter of 2017.
Second Quarter 2017 Financial Results
The Company today also announced its unaudited financial results for the second quarter of 2017. Because the majority of revenue and losses are related to the Acquired Businesses being sold, the consolidated results are not indicative of the Company’s future financial outlook. As such, the Company is only presenting a brief summary for informational purposes.
Second quarter revenue of $151.6 million was down 3.2% sequentially and down 39.4% year-over-year. Net loss was $31.5 million, compared to net loss of $23.2 million in Q1 2017 and net income of $5.5 million in Q2 2016.
The Company recognized revenue of $3.1 million from the sale of rooftop projects of 3.0 MW in China’s domestic distributed generation market in Q2 2017. The Company also signed an agreement to sell a utility-scale project located in North Carolina with a capacity of approximately 6.75 MW with revenue expected to be recognized in Q3 2017. Subsequent to the end of the quarter, the Company signed additional agreements to sell projects overseas, including (i) two ground-mount projects in the United Kingdom with a combined capacity of approximately 10 MW; and (ii) a portfolio of ground-mount projects in North Carolina with an aggregate capacity of 24 MW. These projects are expected to be connected to the grid by December 2017.
Conference Call Information
ReneSola’s management will host an earnings conference call on September 27, 2017 at 8:30 a.m. U.S. Eastern Time (8:30 p.m. China Time).
Dial-in details for the earnings conference call are as follows:
Phone Number |
Toll-Free Number | |
| United States | +1 8456750437 | +1 8665194004 |
| Hong Kong | +852 30186771 | +852 800906601 |
| Mainland China | +86 8008190121
+86 4006208038 |
|
| Other International | +65 67135090 |
Please dial in 10 minutes before the call is scheduled to begin and provide the passcode to join the call. The passcode is 77739816.
A replay of the conference call may be accessed by phone at the following numbers until October 5, 2017. To access the replay, please again reference the conference passcode 77739816.
Phone Number |
Toll-Free Number | |
| United States | +1 6462543697 | +1 8554525696 |
| Hong Kong | +852 30512780 | +852 800963117 |
| Mainland China | +86 8008700206
+86 4006322162 |
|
| Other International | +61 281990299 |
Additionally, a live and archived webcast of the conference call will be available on the Investor Relations section of ReneSola’s website at http://www.renesola.com.
About ReneSola
Founded in 2005, and listed on the New York Stock Exchange in 2008, ReneSola (NYSE: SOL) is an international leading brand of solar project developer and technology provider of energy efficient products. Leveraging its global presence, expansive distribution and sales network, ReneSola is well positioned to develop green energy projects with attractive return and provide its highest quality green energy products around the world. For more information, please visit www.renesola.com.
Safe Harbor Statement
This press release contains statements that constitute ”forward-looking” statements within the meaning of Section 27A of the Securities Act of 1933, as amended, and Section 21E of the Securities Exchange Act of 1934, as amended, and as defined in the U.S. Private Securities Litigation Reform Act of 1995. Whenever you read a statement that is not simply a statement of historical fact (such as when the Company describes what it “believes,” “expects” or “anticipates” will occur, what “will” or “could” happen, and other similar statements), you must remember that the Company’s expectations may not be correct, even though it believes that they are reasonable. The Company does not guarantee that the forward-looking statements will happen as described or that they will happen at all. Further information regarding risks and uncertainties that could cause actual results to differ materially from those in the forward-looking statements is included in the Company’s filings with the U.S. Securities and Exchange Commission, including the Company’s annual report on Form 20-F. The Company undertakes no obligation, beyond that required by law, to update any forward-looking statement to reflect events or circumstances after the date on which the statement is made, even though the Company’s situation may change in the future.
| RENESOLA LTD | ||||||
| Unaudited Consolidated Balance Sheets | ||||||
| (US dollars in thousands) | ||||||
| Jun 30, | Mar 31, | Jun 30, | ||||
| 2017 | 2017 | 2016 | ||||
| ASSETS | ||||||
| Current assets: | ||||||
| Cash and cash equivalents | 28,633 | 26,634 | 23,723 | |||
| Restricted cash | 110,661 | 117,783 | 139,645 | |||
| Accounts receivable, net of allowances for doubtful accounts |
112,185 | 108,230 | 185,573 | |||
| Inventories | 92,291 | 153,220 | 165,470 | |||
| Advances to suppliers-current | 15,891 | 15,727 | 23,286 | |||
| Amounts due from related parties | 12,553 | 9,385 | 77 | |||
| Value added tax recoverable | 8,084 | 10,956 | 5,911 | |||
| Prepaid income tax | 1,142 | 1,115 | 4,338 | |||
| Prepaid expenses and other current assets | 20,723 | 16,002 | 18,288 | |||
| Project assets | 116,869 | 75,574 | 64,756 | |||
| Deferred convertible notes issue costs-current | ||||||
| Derivative assets | 124 | – | 2,077 | |||
| Assets held-for-sale | – | 8,540 | – | |||
| Deferred tax assets-current, net | – | – | – | |||
| Total current assets | 519,156 | 543,166 | 633,144 | |||
| Property, plant and equipment, net | 537,595 | 486,278 | 568,090 | |||
| Prepaid land use right, net | 32,204 | 31,923 | 35,842 | |||
| Deferred tax assets-non-current, net | 16,766 | 19,168 | 14,403 | |||
| Advances for purchases of property, plant and equipment |
3,554 | 1,824 | 285 | |||
| Deferred project costs | 20,913 | 19,153 | 17,576 | |||
| Project assets-noncurrent | 4,537 | 6,103 | 9,463 | |||
| Other long-lived assets | 20,201 | 18,706 | 9,943 | |||
| Total assets | 1,154,926 | 1,126,321 | 1,288,746 | |||
| LIABILITIES AND SHAREHOLDERS’ EQUITY | ||||||
| Current liabilities: | ||||||
| Convertible bond payable-current | ||||||
| Short-term borrowings | 671,432 | 647,587 | 716,512 | |||
| Accounts payable | 203,185 | 221,580 | 280,609 | |||
| Advances from customers-current | 83,954 | 36,701 | 20,342 | |||
| Amounts due to related parties | 5,076 | 4,575 | 2,831 | |||
| Other current liabilities | 61,473 | 59,655 | 66,536 | |||
| Income tax payable | 318 | 302 | 128 | |||
| Derivative liabilities | – | 371 | – | |||
| Warrant liability | – | – | 26 | |||
| Total current liabilities | 1,025,438 | 970,771 | 1,086,984 | |||
| Convertible notes payable-non-current | ||||||
| Long-term borrowings | 30,328 | 31,057 | – | |||
| Deferred revenue | 33,305 | 32,566 | 28,366 | |||
| Warranty | 28,704 | 28,114 | 38,870 | |||
| Deferred subsidies and other | 21,267 | 20,943 | 22,203 | |||
| Other long-term liabilities | 1,139 | 939 | 15 | |||
| Total liabilities | 1,140,181 | 1,084,390 | 1,176,438 | |||
| Shareholders’ equity | ||||||
| Common shares | 476,658 | 476,658 | 477,171 | |||
| Additional paid-in capital | 8,569 | 8,420 | 7,994 | |||
| Accumulated loss | (524,665) | (493,215) | (424,020) | |||
| Accumulated other comprehensive income | 53,385 | 50,068 | 51,163 | |||
| Total equity attribute to ReneSola Ltd | 13,947 | 41,931 | 112,308 | |||
| Noncontrolling interest | 798 | – | – | |||
| Total shareholders’ equity | 14,745 | 41,931 | 112,308 | |||
| Total liabilities and shareholders’ equity | 1,154,926 | 1,126,321 | 1,288,746 | |||
View Table Fullscreen
| RENESOLA LTD | |||||||||||||||||||
| Unaudited Consolidated Statements of Income | |||||||||||||||||||
| (US dollar in thousands, except ADS and share data) | |||||||||||||||||||
| Three Months Ended | Six Months Ended | ||||||||||||||||||
| Jun 30, 2017 | Mar 31, 2017 | Jun 30, 2016 | Jun 30, 2017 | Jun 30, 2016 | |||||||||||||||
| Net revenues from third parties | 151,632 | 148,267 | 250,038 | 299,899 | 510,734 | ||||||||||||||
| Net revenues from related parties | – | 8,343 | – | 8,343 | 0 | ||||||||||||||
| Total net revenues | 151,632 | 156,610 | 250,038 | 308,242 | 510,734 | ||||||||||||||
| Cost of revenues | (147,509) | (154,889) | (208,886) | (302,398) | (425,077) | ||||||||||||||
| Gross profit | 4,123 | 1,721 | 41,152 | 5,844 | 85,657 | ||||||||||||||
| GP% | 2.72% | 1.10% | 16.50% | 1.9% | 16.8% | ||||||||||||||
| Operating (expenses) income: | |||||||||||||||||||
| Sales and marketing | (11,753) | (3,776) | (15,152) | (15,529) | (28,652) | ||||||||||||||
| General and administrative | (12,649) | (12,450) | (13,525) | (25,099) | (26,794) | ||||||||||||||
| Research and development | (5,352) | (5,707) | (7,424) | (11,059) | (15,614) | ||||||||||||||
| Other operating income | 5,250 | 2,458 | 1,324 | 7,708 | 4,018 | ||||||||||||||
| Total operating expenses | (24,504) | (19,475) | (34,777) | (43,979) | (67,042) | ||||||||||||||
| Income (loss) from operations | (20,381) | (17,754) | 6,375 | (38,135) | 18,615 | ||||||||||||||
| -13.40% | -6.30% | 2.50% | -12.37% | 3.64% | |||||||||||||||
| Non-operating (expenses) income: | |||||||||||||||||||
| Interest income | 378 | 312 | 715 | 690 | 1,492 | ||||||||||||||
| Interest expense | (8,571) | (9,248) | (8,477) | (17,819) | (18,337) | ||||||||||||||
| Foreign exchange gains (losses) | (78) | 161 | 4,336 | 83 | 7,281 | ||||||||||||||
| Gains (losses) on derivatives, net | (411) | (332) | 2,869 | (743) | 2,267 | ||||||||||||||
| Investment gain on disposal of subsidiaries | – | – | – | 0 | 7 | ||||||||||||||
| Gains on repurchase of convertible bonds | – | – | – | 0 | 213 | ||||||||||||||
| Fair value change of warrant liability | – | – | 131 | 0 | 551 | ||||||||||||||
| Income (loss) before income tax, noncontrolling interests |
(29,063) | (26,861) | 5,949 | (55,924) | 12,089 | ||||||||||||||
| Income tax (expense) benefit | (2,396) | 3,621 | (425) | 1,225 | (832) | ||||||||||||||
| Net income (loss) | (31,459) | (23,240) | 5,524 | (54,699) | 11,257 | ||||||||||||||
| Less: Net income (loss) attributed to noncontrolling interests |
(9) | 0 | 0 | (9) | 0 | ||||||||||||||
| Net income (loss) attributed to holders of ordinary shares |
(31,450) | (23,240) | 5,524 | (54,690) | 11,257 | ||||||||||||||
| Earnings per share | |||||||||||||||||||
| Basic | (0.16) | (0.12) | 0.03 | (0.27) | 0.06 | ||||||||||||||
| Diluted | (0.16) | (0.12) | 0.03 | (0.27) | 0.06 | ||||||||||||||
| Earnings per ADS | |||||||||||||||||||
| Basic | (1.57) | (1.16) | 0.27 | (2.73) | 0.56 | ||||||||||||||
| Diluted | (1.57) | (1.16) | 0.27 | (2.73) | 0.56 | ||||||||||||||
| Weighted average number of shares used in computing loss per share | |||||||||||||||||||
| Basic | 200,538,902 | 200,538,902 | 201,998,340 | 200,538,902 | 202,580,825 | ||||||||||||||
| Diluted | 200,538,902 | 200,538,902 | 201,998,340 | 200,538,902 | 202,580,825 | ||||||||||||||
| RENESOLA LTD | |||||||||||||||||||
| Unaudited Consolidated Statements of Comprehensive Income (loss) | |||||||||||||||||||
| (US dollar in thousands) | |||||||||||||||||||
| Three Months Ended | Six Months Ended | ||||||||||||||||||
| Jun 30, 2017 | Mar 31, 2017 | Jun 30, 2016 | Jun 30, 2017 | Jun 30, 2016 | |||||||||||||||
| Net income (loss) | (31,459) | (23,240) | 5,524 | (54,699) | 11,257 | ||||||||||||||
| Other comprehensive income (loss) | |||||||||||||||||||
| Foreign exchange translation adjustment | 3,317 | (1,165) | (7,921) | 2,152 | (10,414) | ||||||||||||||
| Other comprehensive income (loss) | 3,317 | (1,165) | (7,921) | 2,152 | (10,414) | ||||||||||||||
| Comprehensive income (loss) | (28,142) | (24,405) | (2,397) | (52,547) | 843 | ||||||||||||||
| Less:comprehensive loss attributable to non-controlling interest | (9) | – | – | (9) | 0 | ||||||||||||||
| Comprehensive income (loss) attributable to ReneSola | (28,133) | (24,405) | (2,397) | (52,538) | 843 | ||||||||||||||
| RENESOLA LTD | |||||||||||||||||||
| Unaudited Consolidated Statements of Cash Flow | |||||||||||||||||||
| (US dollar in thousands) | |||||||||||||||||||
| Six Months Ended | |||||||||||||||||||
| Jun 30, 2017 | Jun 30, 2016 | ||||||||||||||||||
| Operating activities: | |||||||||||||||||||
| Net profit/(loss) | (54,690) | 11,257 | |||||||||||||||||
| Adjustment to reconcile net loss to net cash provided by (used in) operating activity: | |||||||||||||||||||
| Inventory write-down | 4,032 | – | |||||||||||||||||
| Depreciation and amortization | 38,766 | 39,275 | |||||||||||||||||
| Amortization of deferred convertible bond issuances costs and premium | – | 33 | |||||||||||||||||
| Allowance of doubtful receivables, advance to suppliers and prepayment for purchases of property, plant and equipment |
1,570 | 131 | |||||||||||||||||
| Gain (loss) on derivatives | 743 | (2,088) | |||||||||||||||||
| Fair value change of warrant liability | – | (551) | |||||||||||||||||
| Gain from settlement of certain payables | |||||||||||||||||||
| Gain from advances from customers | |||||||||||||||||||
| Share-based compensation | 339 | 512 | |||||||||||||||||
| Gain (loss) on disposal of long-lived assets | (3,087) | 5,358 | |||||||||||||||||
| Gain on disposal of solar project | – | (2,527) | |||||||||||||||||
| Impairment of goodwill | |||||||||||||||||||
| Impairment of Intangible assets | |||||||||||||||||||
| Impairment of long-lived assets | |||||||||||||||||||
| Reversal of firm purchase commitment | |||||||||||||||||||
| Gain on disposal of subsidiaries | |||||||||||||||||||
| Gain on CB repurchase | – | (212) | |||||||||||||||||
| Changes in assets and liabilities: | |||||||||||||||||||
| Accounts receivable | 114 | (29,480) | |||||||||||||||||
| Inventories | 2,008 | 1,119 | |||||||||||||||||
| Project assets and deferred project cost | (64,395) | (25,676) | |||||||||||||||||
| Advances to suppliers | (283) | (6,354) | |||||||||||||||||
| Amounts due from related parties | 119 | 257 | |||||||||||||||||
| Value added tax recoverable | (4,342) | 18,668 | |||||||||||||||||
| Prepaid expenses and other assets | 7,464 | 6,658 | |||||||||||||||||
| Prepaid land use rights, net | 1,342 | 464 | |||||||||||||||||
| Accounts payable | (26,413) | (12,643) | |||||||||||||||||
| Advances from customers | 63,261 | (8,198) | |||||||||||||||||
| Income tax payable | (51) | (778) | |||||||||||||||||
| Other current liabilities | 2,099 | (10,050) | |||||||||||||||||
| Deferred revenue | – | (4,010) | |||||||||||||||||
| Other non-current assets | – | (458) | |||||||||||||||||
| Other long-term assets | |||||||||||||||||||
| Warranty | (7,002) | 3,821 | |||||||||||||||||
| Deferred taxes assets | (468) | 1,959 | |||||||||||||||||
| Other long-term liabilities | 249 | – | |||||||||||||||||
| Net cash provided by (used in) operating activities | (38,625) | (13,513) | |||||||||||||||||
| Investing activities: | |||||||||||||||||||
| Purchases of property, plant and equipment | (22,750) | (4,162) | |||||||||||||||||
| Advances for purchases of property, plant and equipment | (5,368) | 5,140 | |||||||||||||||||
| Cash received from government subsidy | |||||||||||||||||||
| Proceeds from disposal of property, plant and equipment | 74 | – | |||||||||||||||||
| Advance from disposal of property, plant and equipment | 2,916 | – | |||||||||||||||||
| Changes in restricted cash | (12,248) | (2,895) | |||||||||||||||||
| Cash consideration for investment, net of cash received | (885) | – | |||||||||||||||||
| Net cash received (paid) on settlement of derivatives | (621) | 179 | |||||||||||||||||
| Purchases of investment securities | |||||||||||||||||||
| Proceeds from disposal of subsidiaries | |||||||||||||||||||
| Net cash provided by (used in) investing activities | (38,882) | (1,738) | |||||||||||||||||
| Financing activities: | |||||||||||||||||||
| Proceeds from bank borrowings | 473,657 | 497,630 | |||||||||||||||||
| Proceeds from related parties | 4,374 | – | |||||||||||||||||
| Repayment of bank borrowings | (412,199) | (464,338) | |||||||||||||||||
| Proceeds from exercise of stock options | |||||||||||||||||||
| Paid for CB repurchase | |||||||||||||||||||
| Share issuance costs | |||||||||||||||||||
| Repurchace from noncontrolling interests | 798 | – | |||||||||||||||||
| Repurchase of convertible notes | – | (25,931) | |||||||||||||||||
| Cash paid for ADS/s repurchase | – | (981) | |||||||||||||||||
| Net cash provided by (used in) financing activities | 66,630 | 6,380 | |||||||||||||||||
| Effect of exchange rate changes | 2,174 | (5,451) | |||||||||||||||||
| Net increase (decrease) in cash and cash equivalents | (8,703) | (14,322) | |||||||||||||||||
| Cash and cash equivalents, beginning of period/year | 37,336 | 38,045 | |||||||||||||||||
| Cash and cash equivalents, end of period/year | 28,633 | 23,723 | |||||||||||||||||


