


The lockdown has led to a large reduction in peak electricity demand across the five electricity regions of the country.
The world’s largest COVID-19 lockdown has been in place for the past fortnight in India where 1.3 billion people are advised to stay at home for 21 days. Most of the offices, large and small-scale industries, commercial establishments (malls, theaters, supermarkets etc) are ordered to remain shut to control the spread of COVID-19. Schools, colleges and religious places are also shut to control the disease spread. Only hospitals, a few essential industries and a few commercial establishments are allowed to operate. Even Indian Railways has stopped its operation making public transport coming to a standstill in the entire country.
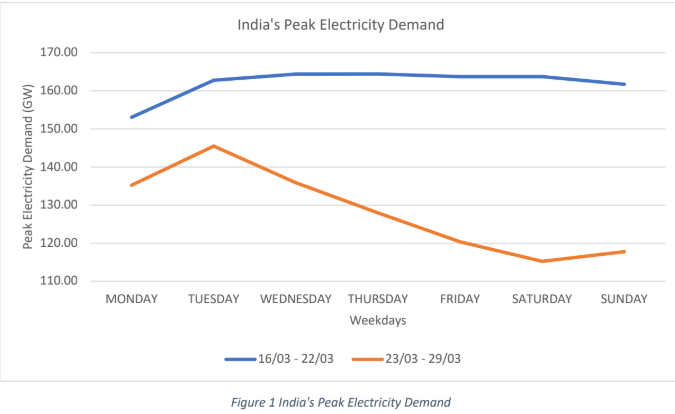
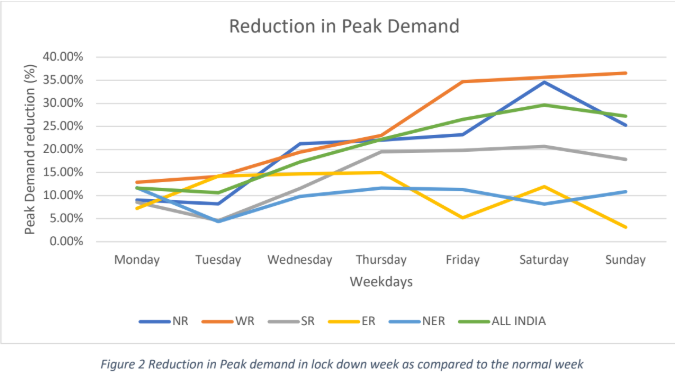
This situation has led to a large reduction in peak electricity demand across the five electricity regions of the country. The above figure (Figure 1) depicts the all India peak electricity demand for the preceding two weeks. The week (16/03 – 22/03) was a normal week and the week (23/03 – 29/03) was a lockdown week. In the lockdown week, all India peak demand on an average was reduced by 20 per cent when compared to the normal week. On Saturday (28/03) the all India peak demand was 115 GW down from 164 GW on Saturday (21/03) of the previous week i.e., a reduction in peak demand of close to 30 per cent. Figure 2 presents the percentage reduction in peakdemand during the lockdown week (23/03 – 29/03) as compared to the normal week (16/03 – 22/03) across the different electricity regions of the country. As is observed from the figure, on an average across the lockdown week, the western region (WR) in the country felt the highest peak demand reduction of 25.19 per cent followed by northern (NR), southern (SR), eastern (ER) and north eastern region (NER) with 20.49 per cent, 14.66 per cent, 10.21 per cent and 9.70 per cent respectively.The state of Maharashtra and Gujarat (two of the major industrialized states in India) are the two highest consumers of electricity in India and that is the main reason for highest reduction in peak demand in the western region. The peak demand reduction in NER is low when compared to the other regions as there are not many industries in NER. Further, the electricity demand from railways too was very less. The same can be attributed to the eastern region too where the concentration of industries is less. In the SR especially with the closure of Multinational corporations, there is a substantial reduction in the peak demand.
Peak demand reduction and its implications for electricity supply
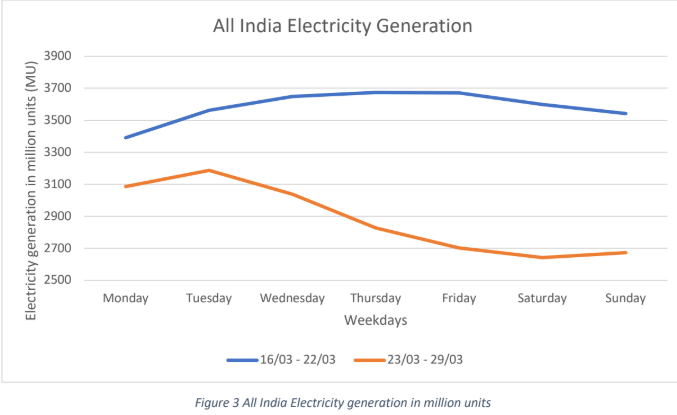
The total installed capacity of India as of February 2020 is 369 GW (Coal 198 GW, *Renewable energy sources (RES) 88 GW and others) and with the highest peak demand of only 146 GW (24/03) in the lockdown week, the peak demand is just 40 per cent of the installed capacity. Even during the normal week with peak demand of 164 MW (19/03), India has abundant supply to meet the electricity demand. Figure 3 shows all-India electricity generation in million units (MU) for the normal week and the lockdown week. In the normal week the generation was as high as 3674 MU on 19/03 (Thursday) and it has reduced to 2,642 MU on 28/03 (Saturday) in the lockdown week i.e. the electricity generation has reduced by 27 per cent.
With more renewable energy resources added into the electricity system and the difficulty in switching off the renewable power, the generation from the fossil fuel power plants (coal and lignite) has been reduced. Figure 4 picturizes the electricity generation from coal and renewable energy sources for both the normal and lockdown weeks. With generation from renewable energy sources quite stable, the generation from coal power plants is significantly reduced to meet the lesser demand. In the normal week the average generation from coal-based power plants was 2,570 MUs and it has reduced to 1,986 MU whereas in the corresponding period the averagegeneration for RES was 341 MU and 284 MU respectively. However, a majority of the reduction is experienced in coal-based power plants. While these power plants have enough resources to operate and they are in good condition due to the reduction in demand, these power plants are intentionally shut. We can observe from the above data even in the normal week the generation was far less when compared to the available installed capacity.

Figure 5 presents the plant load factor (PLF) of Coal and lignite-based power plants from 2009-10 to 2019-20. As we can observe from the figure, *PLF of 2019-20 (56.40 per cent) is at the lowest in the last 10 years and it is expected to decrease even further with this lockdown.
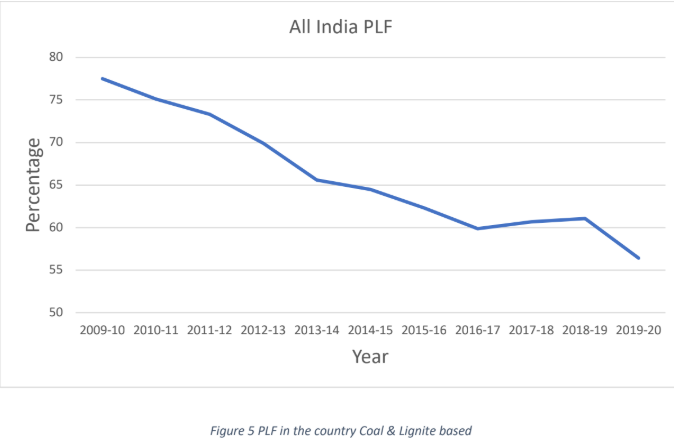
This reduction in PLF indicates there are more coal-based power plants sitting idle without any electricity generation. This will have an adverse impact on the revenue of power plants. As compared to normal times with this lockdown the utilities are expected to lose even more due to the idle state of the power plants. Moreover, with the increase in generation of RES the operation of coal-based power plants is correspondingly reduced and with this lockdown, it is even lowered resulting in loss to the utilities. The days of power shut down and the dark days of July and August 2012 blackout are long gone and now the country has high installed capacity and the generation surplus. This situation is foreseen, and it is expected with the addition of more RES into the installed capacity of electricity system. The same scenario is expected to prevail for a few more years with the expected addition of more RES and coal capacity into India’s installed electricity capacity. However, with the increase in demand the situation is expected to become smooth in some years. Till then, the loss for the utilities cannot be controlled as the installed capacity is for the future and not for the present and a brighter day will emerge in financial terms sooner rather than later.
* RES (Renewable Energy Sources) include Small Hydro Project, Biomass Gasifier, Biomass Power, Urban & Industrial Waste Power, Solar and Wind Energy.
*PLF – PLF is the ratio of average power generated by the plant to the maximum power that could have been generated in a given time.
DISCLAIMER: The views expressed are solely of the author and ETEnergyworld.com does not necessarily subscribe to it. ETEnergyworld.com shall not be responsible for any damage caused to any person/organisation directly or indirectly.