


Details of power generation from fuel sources (Thermal, Hydro & Nuclear) of 25 MW and above by the Central Generating Stations in the country during the last three years and current year i.e. from 2016-17 to 2019-20 (up to October, 2019) is given at Annexure-I. Also, details of Renewable Energy Generation data of Central Public Sector Undertakings (CPSUs) Stations available in Central Electricity Authority (CEA) for year 2018-19 and current year 2019-20 (up to September, 2019) is given at Annexure-II.
The details of the allocation of power from Central Generating Stations to each State/UT during the last three years i.e. 2016-17 (as on 31.03.2017), 2017-18 (as on 31.03.2018) and 2018-19 (as on 31.03.2019), are given at Annexures III, IV and V respectively.
In case of need and request from the States/UTs, Government of India/Ministry of Power has been considering enhancement of the power allocation to the States/UTs from the unallocated quota of the Central Generating Stations, keeping in view the overall availability and requirement of the various States/UTs.
During the year 2019-20 (up to October 2019), requests for additional allocation of power were received from Puducherry, Andhra Pradesh, Assam and Jammu & Kashmir, and request for reducing allocation was received from Chandigarh. The details in this regard are as under:
- In June, 2019, Puducherry had requested for continuation of their allocation of 40 MW from unallocated quota of Central Generating Stations of Southern Region with effect from 01.07.2019 and the same was allowed accordingly.
- In August, 2019, Andhra Pradesh had requested for additional allocation of 1000 MW of power for the month of September, 2019, and the same was allocated from the surrendered share of other States in Central Generating Stations of Northern and Western Regions.
(iii) Assam had in October, 2019, requested for allocation of 65 MW and it was recommended that the same can be considered for allocation from the surrendered share of other States in Central Generating Stations of NTPC if Assam gives its consent.
(iv) In October, 2019, Jammu & Kashmir requested for an enhancement in the allocation of power for the winter months. The allocation to Jammu & Kashmir from the unallocated quota of Central Generating Stations in Northern Region has been increased from 30% to 78% of unallocated power of Northern region for the winter months.
(v) Chandigarh had in October, 2019, requested for reduction in their allocation from 14% to 9% from the unallocated quota of Central Generating Stations in Northern Region and the same has been given effect to.
This information was provided by Union Minister of State (IC) Power, New & Renewable Energy and Skill Development and Entrepreneurship Shri R.K. Singh, in written reply to a question in Lok Sabha today.
*********
ANNEXURE-I
Generation details of Central Generating Stations during the last three years and current year up to October, 2019.
| NAME OF STATION | Fuel | *Monitored Capacity as on 31.10.2019 MW | GENERATION (MU) | |||
| 2016-17 | 2017-18 | 2018-19 | *2019-20 (up to-Oct. 19) | |||
| BADARPUR TPS | COAL | 0.00 | 1704.85 | 1556.97 | 1400.33 | 0.00 |
| BARAUNI TPS | COAL | 710.00 | – | – | 44.85 | 80.25 |
| BARH II | COAL | 1320.00 | 7642.01 | 9272.35 | 9845.23 | 5749.11 |
| BHILAI TPS | COAL | 500.00 | 3651.19 | 3877.77 | 3426.23 | 1742.18 |
| BOKARO `B` TPS | COAL | 210.00 | 1456.68 | 573.94 | 688.44 | 94.03 |
| BOKARO TPS `A` EXP | COAL | 500.00 | 208.00 | 2924.25 | 2920.75 | 1523.32 |
| BONGAIGAON TPP | COAL | 750.00 | 1680.27 | 1732.17 | 2824.21 | 2197.67 |
| CHANDRAPURA(DVC) TPS | COAL | 630.00 | 5642.70 | 4075.82 | 3560.59 | 1978.61 |
| DADRI (NCTPP) | COAL | 1820.00 | 8765.46 | 9933.39 | 10533.54 | 4608.69 |
| DURGAPUR STEEL TPS | COAL | 1000.00 | 6655.77 | 6503.85 | 6293.54 | 3613.01 |
| DURGAPUR TPS | COAL | 210.00 | 592.72 | 947.10 | 981.28 | 218.33 |
| FARAKKA STPS | COAL | 2100.00 | 13743.98 | 13356.91 | 14846.44 | 7534.09 |
| GADARWARA TPP | COAL | 800.00 | – | – | 0.00 | 623.06 |
| INDIRA GANDHI STPP | COAL | 1500.00 | 5473.77 | 7734.53 | 7387.28 | 2260.28 |
| KAHALGAON TPS | COAL | 2340.00 | 15947.93 | 16316.65 | 16485.91 | 9492.38 |
| KHARGONE STPP | COAL | 660.00 | – | – | – | 198.89 |
| KODARMA TPP | COAL | 1000.00 | 3801.77 | 5911.30 | 6278.75 | 3896.15 |
| KORBA STPS | COAL | 2600.00 | 20364.88 | 20477.94 | 20083.42 | 11190.80 |
| KUDGI STPP | COAL | 2400.00 | 25.49 | 3945.19 | 7566.33 | 2148.74 |
| LARA TPP | COAL | 800.00 | – | 0.00 | 262.91 | 733.01 |
| MAUDA TPS | COAL | 2320.00 | 4305.65 | 7971.14 | 11878.13 | 6575.80 |
| MEJA STPP | COAL | 660.00 | – | 8.22 | 69.61 | 1050.67 |
| MEJIA TPS | COAL | 2340.00 | 12936.78 | 12478.48 | 12744.35 | 7600.02 |
| MUZAFFARPUR TPS | COAL | 610.00 | 793.49 | 1750.61 | 3039.78 | 1893.93 |
| NABI NAGAR TPP | COAL | 750.00 | 0.00 | 1060.94 | 2754.75 | 2566.82 |
| NABINAGAR STPP | COAL | 660.00 | – | 0.00 | 0.00 | 344.05 |
| PATRATU TPS | COAL | – | 385.88 | 0.00 | 0.00 | – |
| RAGHUNATHPUR TPP | COAL | 1200.00 | 2016.51 | 2279.47 | 3208.40 | 3141.69 |
| RAMAGUNDEM STPS | COAL | 2600.00 | 19597.52 | 18867.65 | 18547.91 | 10266.50 |
| RIHAND STPS | COAL | 3000.00 | 21959.62 | 23530.54 | 22686.80 | 13429.54 |
| SIMHADRI | COAL | 2000.00 | 14173.49 | 11773.71 | 12449.08 | 5880.28 |
| SINGRAULI STPS | COAL | 2000.00 | 15219.06 | 14781.83 | 14798.21 | 8863.48 |
| SIPAT STPS | COAL | 2980.00 | 23778.93 | 23009.82 | 23907.12 | 12173.74 |
| SOLAPUR | COAL | 1320.00 | 0.00 | 1397.56 | 1783.67 | 661.36 |
| TALCHER (OLD) TPS | COAL | 460.00 | 3759.53 | 3780.71 | 3606.84 | 1889.31 |
| TALCHER STPS | COAL | 3000.00 | 22847.48 | 22976.99 | 21242.30 | 10457.50 |
| TANDA TPS | COAL | 1100.00 | 3241.42 | 3277.98 | 2371.80 | 1591.86 |
| TUTICORIN (JV) TPP | COAL | 1000.00 | 6252.04 | 5412.83 | 5486.62 | 2237.80 |
| UNCHAHAR TPS | COAL | 1550.00 | 6993.65 | 7092.48 | 7241.00 | 5229.38 |
| VALLUR TPP | COAL | 1500.00 | 9210.86 | 7167.72 | 7706.87 | 3180.91 |
| VINDHYACHAL STPS | COAL | 4760.00 | 32206.94 | 37495.73 | 37539.00 | 20817.60 |
| BARSINGSAR LIGNITE | LIGNITE | 250.00 | 1463.25 | 1648.81 | 1357.10 | 848.28 |
| NEYVELI ( EXT) TPS | LIGNITE | 420.00 | 3328.33 | 3247.15 | 2949.65 | 1879.88 |
| NEYVELI TPS- I | LIGNITE | 500.00 | 3696.52 | 3379.73 | 3105.90 | 1686.08 |
| NEYVELI TPS-II | LIGNITE | 1470.00 | 11052.08 | 10262.56 | 10744.54 | 5885.70 |
| NEYVELI TPS-II EXP | LIGNITE | 500.00 | 1373.25 | 2009.90 | 1931.31 | 998.10 |
| AGARTALA GT | NATURAL GAS | 135.00 | 904.58 | 688.27 | 650.63 | 414.77 |
| ANTA CCPP | NATURAL GAS | 419.33 | 695.18 | 450.94 | 550.65 | 270.50 |
| AURAIYA CCPP | NATURAL GAS | 663.36 | 535.67 | 376.97 | 544.96 | 305.20 |
| DADRI CCPP | NATURAL GAS | 829.78 | 2236.96 | 1627.81 | 1661.51 | 1232.27 |
| FARIDABAD CCPP | NATURAL GAS | 431.59 | 1034.05 | 837.38 | 597.09 | 209.65 |
| GANDHAR CCPP | NATURAL GAS | 657.39 | 2358.82 | 3111.93 | 1573.91 | 341.19 |
| KATHALGURI CCPP | NATURAL GAS | 291.00 | 1572.63 | 1598.25 | 1639.49 | 944.87 |
| KAWAS CCPP | NATURAL GAS | 656.20 | 1718.18 | 2405.90 | 2499.39 | 996.92 |
| MONARCHAK CCPP | NATURAL GAS | 101.00 | 172.05 | 671.53 | 681.27 | 396.42 |
| RATNAGIRI CCPP | NATURAL GAS | 1967.08 | – | 4501.03 | 4465.63 | 2538.04 |
| RATNAGIRI CCPP II | NATURAL GAS | – | 2438.41 | – | – | – |
| RATNAGIRI CCPP III | NATURAL GAS | – | 2119.31 | – | – | – |
| TRIPURA CCPP | NATURAL GAS | 726.60 | 4173.07 | 4053.16 | 4711.38 | 2767.23 |
| DAE (RAJASTHAN) | NUCLEAR | 100.00 | 0.00 | 0.00 | 0.00 | 0.00 |
| KAIGA | NUCLEAR | 880.00 | 6533.49 | 7533.41 | 7216.53 | 4247.86 |
| KAKRAPARA | NUCLEAR | 440.00 | 0.00 | 0.00 | 999.93 | 1915.44 |
| KUDANKULAM | NUCLEAR | 2000.00 | 6466.02 | 8718.54 | 6142.61 | 6763.37 |
| MADRAS A.P.S. | NUCLEAR | 440.00 | 3204.67 | 2975.74 | 1490.93 | 1080.31 |
| NARORA A.P.S. | NUCLEAR | 440.00 | 3378.89 | 3636.38 | 3161.89 | 2171.86 |
| RAJASTHAN A.P.S. | NUCLEAR | 1080.00 | 7472.60 | 8605.80 | 8034.28 | 5082.67 |
| TARAPUR | NUCLEAR | 1400.00 | 10860.20 | 6876.25 | 10766.42 | 6933.60 |
| BAIRA SIUL HPS | HYDRO | 180.00 | 669.33 | 641.73 | 366.67 | 156.78 |
| BHAKRA H P S | HYDRO | – | 5168.27 | 5134.02 | – | – |
| BHAKRA LEFT HPS | HYDRO | 594.00 | – | – | 2248.69 | 1848.61 |
| BHAKRA RIGHT HPS | HYDRO | 785.00 | – | – | 1989.50 | 2529.89 |
| CHAMERA- I HPS | HYDRO | 540.00 | 2224.39 | 2344.08 | 2484.56 | 2135.77 |
| CHAMERA- II HPS | HYDRO | 300.00 | 1443.93 | 1487.11 | 1508.02 | 994.80 |
| CHAMERA-III HPS | HYDRO | 231.00 | 917.09 | 1068.05 | 1043.42 | 907.79 |
| CHUTAK HPS | HYDRO | 44.00 | 44.12 | 45.72 | 48.96 | 74.22 |
| DEHAR H P S | HYDRO | 990.00 | 3184.68 | 3086.24 | 3226.30 | 2739.66 |
| DHAULI GANGA HPS | HYDRO | 280.00 | 956.13 | 1153.16 | 1106.21 | 1130.93 |
| DOYANG HPS. | HYDRO | 75.00 | 258.94 | 274.39 | 231.47 | 129.15 |
| DULHASTI HPS | HYDRO | 390.00 | 2280.02 | 2343.86 | 2273.38 | 1515.32 |
| GANGUWAL HPS | HYDRO | 77.65 | 416.54 | 494.09 | 599.37 | 359.78 |
| INDIRA SAGAR HPS | HYDRO | 1000.00 | 3320.79 | 881.76 | 1308.79 | 1955.71 |
| KHONDONG HPS. | HYDRO | 50.00 | 197.10 | 260.77 | 203.82 | 152.39 |
| KISHANGANGA HPS | HYDRO | 330.00 | 0.00 | 1.68 | 529.25 | 712.47 |
| KOLDAM | HYDRO | 800.00 | 3225.16 | 3313.62 | 3013.93 | 2953.26 |
| KOPILI HPS. | HYDRO | 200.00 | 1088.27 | 1172.83 | 1117.82 | 717.16 |
| KOTESHWAR HPS | HYDRO | 400.00 | 1224.55 | 1220.33 | 1223.84 | 748.62 |
| KOTLA HPS | HYDRO | 77.65 | 430.58 | 508.22 | 609.60 | 367.92 |
| LOKTAK HPS. | HYDRO | 105.00 | 741.07 | 837.74 | 602.61 | 222.86 |
| MAITHON HPS. | HYDRO | 63.20 | 122.03 | 114.41 | 101.36 | 53.75 |
| NATHPA JHAKRI HPS | HYDRO | 1500.00 | 7050.64 | 7207.73 | 6507.15 | 6255.19 |
| NIMMO BAZGO HPS | HYDRO | 45.00 | 95.21 | 98.83 | 105.55 | 102.62 |
| OMKARESHWAR HPS | HYDRO | 520.00 | 1427.70 | 443.60 | 612.04 | 828.43 |
| PANCHET HPS. | HYDRO | 80.00 | 133.51 | 141.94 | 79.79 | 84.61 |
| PARBATI-III HPS | HYDRO | 520.00 | 682.48 | 710.53 | 608.30 | 611.10 |
| PARE | HYDRO | 110.00 | 0.00 | 0.00 | 347.16 | 379.02 |
| PONG H P S | HYDRO | 396.00 | 1369.93 | 1641.57 | 1512.56 | 840.20 |
| RAMPUR HPS | HYDRO | 412.02 | 1960.42 | 2015.00 | 1828.76 | 1749.96 |
| RANGANADI HPS. | HYDRO | 405.00 | 1249.01 | 1416.74 | 1051.86 | 1045.13 |
| RANGIT HPS | HYDRO | 60.00 | 347.14 | 345.91 | 349.09 | 263.86 |
| SALAL HPS | HYDRO | 690.00 | 3423.09 | 3247.09 | 3412.55 | 3144.98 |
| SEWA-II HPS | HYDRO | 120.00 | 470.61 | 506.39 | 498.32 | 396.47 |
| TANAKPUR HPS | HYDRO | 94.20 | 430.29 | 459.74 | 452.89 | 412.20 |
| TEESTA LOW DAM-III HPS | HYDRO | 132.00 | 553.87 | 386.87 | 572.06 | 487.25 |
| TEESTA LOW DAM-IV HPS | HYDRO | 160.00 | 602.53 | 495.15 | 708.45 | 612.91 |
| TEESTA V HPS | HYDRO | 510.00 | 2773.46 | 2818.78 | 2701.46 | 2308.07 |
| TEHRI ST-1 HPS | HYDRO | 1000.00 | 3146.32 | 3080.94 | 3172.08 | 1821.89 |
| TUIRIAL HPS | HYDRO | 60.00 | – | 78.37 | 168.44 | 101.91 |
| URI-I HPS | HYDRO | 480.00 | 2803.10 | 2349.66 | 3048.29 | 1991.40 |
| URI-II HPS | HYDRO | 240.00 | 1471.94 | 1207.44 | 1580.92 | 1039.11 |
| R. GANDHI CCPP (Liq.) | NAPTHA | 359.58 | 15.40 | 4.19 | 0.81 | 0.00 |
| GRAND TOTAL | 89864.63 | 433744.17 | 449512.26 | 461125.37 | 276528.20 | |
| * PROVISIONAL BASED ON ACTUAL-CUM-ASSESMENT | ||||||
| 1. Gross Generation from conventional sources (Thermal, Hydro and Nuclear) stations of 25 MW and above only. | ||||||
ANNEXURE-II
Details of Renewable Energy Generation data of CPSUs Stations for year 2018-19 & current year 2019-20 (up to September, 2019)
| Renewable Energy Generation Data (CPSU Wise) for the month of April to September, 2019 | |||||
| Name of CPSU | Name of State | Installed Capacity (MW) | Source | April to September 2019 (In MU) | |
| NTPC | |||||
| NTPC Faridabad Solar | Haryana | 5 | Solar | 3.55 | |
| NTPC Bhadla | Rajasthan | 260 | Solar | 225.28 | |
| NTPC Dadri_Solar | Uttar Pradesh | 5 | Solar | 3.39 | |
| NTPC Unchahar _Solar | Uttar Pradesh | 10 | Solar | 7.58 | |
| NTPC Singrauli _Solar | Uttar Pradesh | 15 | Solar | 10.50 | |
| NTPC Singrauli _SH | Uttar Pradesh | 8 | Small Hydro | 7.60 | |
| NTPC Rojmal | Gujarat | 50 | Wind | 68.60 | |
| NTPC Rajgarh _Solar | Madhya Pradesh | 50 | Solar | 36.62 | |
| NTPC Mandsaur | Madhya Pradesh | 250 | Solar | 181.42 | |
| NTPC Anantapuram | Andhra Pradesh | 250 | Solar | 194.51 | |
| NTPC Ramagundam | Telangana | 10 | Solar | 6.69 | |
| NTPC Andaman Nicobar | Andaman Nicobar | 5 | Solar | 2.47 | |
| NTPC Talchar _Solar | Orissa | 10 | Solar | 6.70 | |
| Total (NTPC) | 928 | 754.91 | |||
| THDC | |||||
| THDC Patan Wind Power Project | Gujarat | 50 | Wind | 66.86 | |
| THDC Devbhumi Dwarka Wind Power Project | Gujarat | 63 | Wind | 98.69 | |
| Total (THDC) | 113 | 165.55 | |||
| NHPC | |||||
| NHPC Wind Power Project | Rajasthan | 50 | Wind | 19.31 | |
| NHPC Solar Power Project | Tamil Nadu | 50 | Solar | 22.10 | |
| Total (NHPC) | 100 | 41.41 | |||
| ONGC | |||||
| ONGC Wind, Bhuj | Gujarat | 51 | Wind | 17.87 | |
| ONGC Wind, Jaisalmer | Rajasthan | 102 | Wind | 82.13 | |
| ONGC Solar, Goa | Goa | 1 | Solar | 0.50 | |
| Total (ONGC) | 154 | 100.49 | |||
| SJVN Limited | |||||
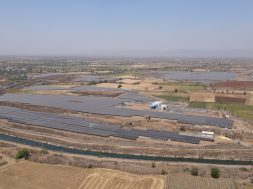
| Khirvire Wind Power | Maharashtra | 47.6 | Wind | 45.43 | |
| Sadla Wind Power | Gujarat | 50 | Solar | 51.28 | |
| Charanka Solar Power | Gujarat | 5.6 | Solar | 2.75 | |
| Total (SJVN) | 103.2 | 99.46 | |||
| Oil India Ltd | |||||
| Oil India Ltd. | Rajasthan | 14 | Solar | 10.73 | |
| Oil India Ltd | Rajasthan | 67.6 | Wind | 42.04 | |
| Oil India Ltd | Gujarat | 43.3 | Wind | 60.50 | |
| Oil India Ltd | Madhya Pradesh | 63.2 | Wind | 82.24 | |
| Total (Oil India Ltd) | 188.1 | 195.52 | |||
| NEEPCO | |||||
| Total (NEEPCO) | Tripura | 5 | Solar | 3.49 | |
| All India Total | 1591.30 | 1360.83 | |||
ANNEXURE-III
ANNEXURE-IV
Details of the allocation of power from Central Generating Stations to each State/UT during the year (2017-18) as on 31.03.2018
| Details of Total Share of the States from Central Generating Stations | (As on 31-03-2018) | |||||
| S.No. | Region / State | Firm power | Unallocated (UA) Power | Total MW share from CGS | ||
| Firm Share from CGS (MW) | Unallocated power from regional pool (MW) | Allocation from other Region / Bhutan (MW) | Total allocation of unallocated power including specific allocation(MW) | |||
| 1 | Chandigarh | 160 | 106 | 14 | 120 | 280 |
| 2 | Delhi | 4814 | 0 | 30 | 30 | 4844 |
| 3 | Haryana | 2576 | 0 | 15 | 15 | 2591 |
| 4 | Himachal Pradesh | 1489 | 15 | 0 | 15 | 1504 |
| 5 | Jammu & Kashmir | 1688 | 863 | 118 | 981 | 2669 |
| 6 | Punjab | 2214 | 37 | 30 | 67 | 2281 |
| 7 | Rajasthan | 2693 | 635 | 52 | 687 | 3380 |
| 8 | Uttar Pradesh | 5845 | 435 | 60 | 495 | 6340 |
| 9 | Uttarakhand | 907 | 170 | 0 | 170 | 1077 |
| 10 | Railways | 0 | 0 | 0 | 0 | 0 |
| 11 | Power Grid | 5 | 4 | 0 | 4 | 9 |
| Northern Region | 22390 | 2265 | 319 | 2584 | 24974 | |
| 12 | Chhattisgarh | 1322 | 25 | 0 | 25 | 1347 |
| 13 | Gujarat | 3995 | 0 | 0 | 0 | 3995 |
| 14 | Madhya Pradesh | 4768 | 413 | 0 | 413 | 5181 |
| 15 | Maharashtra | 6641 | 382 | 0 | 382 | 7023 |
| 16 | Daman & Diu | 174 | 144 | 0 | 144 | 318 |
| 17 | Dadar Nagar Haveli | 244 | 707 | 0 | 707 | 951 |
| 18 | Goa | 497 | 81 | 0 | 81 | 578 |
| 19 | Power Grid | 2.72 | 3 | 0 | 3 | 6.00 |
| 20 | Railways WR | 540 | 0 | 0 | 0 | 540 |
| 21 | HWP of DAE | 0 | 0 | 0 | 0 | 0 |
| 22 | BARC Facilities | 0 | 10 | 0 | 10 | 10 |
| Western Region | 18184 | 1765 | 0 | 1765 | 19948 | |
| 23 | Andhra Pradesh | 1935 | 586 | 0 | 586 | 2521 |
| 24 | Karnataka | 3127 | 801 | 0 | 801 | 3929 |
| 25 | Kerala | 1830 | 214 | 0 | 214 | 2045 |
| 26 | Tamil Nadu | 5838 | 481 | 0 | 481 | 6319 |
| 27 | Telangana | 2027 | 381 | 0 | 381 | 2408 |
| 28 | Pondicherry | 334 | 149 | 0 | 149 | 483 |
| 29 | NLC | 100 | 0 | 0 | 0 | 100 |
| 30 | Power Grid | 0 | 6 | 0 | 6 | 6 |
| Southern Region | 15191 | 2619 | 0 | 2619 | 17810 | |
| 31 | Bihar | 2902 | 604 | 12 | 616 | 3518 |
| 32 | DVC | 6478 | 8 | 8 | 16 | 6494 |
| 33 | Jharkhand | 596 | 138 | 5 | 143 | 739 |
| 34 | Odisha | 1801 | 77 | 6 | 83 | 1884 |
| 35 | West Bengal | 1499 | 86 | 18 | 104 | 1603 |
| 36 | Sikkim | 156 | 12 | 1 | 13 | 169 |
| 37 | Railway | 450 | 0 | 0 | 0 | 450 |
| 38 | Power Grid | 0 | 1 | 0 | 1 | 1 |
| Eastern Region | 13882 | 927 | 50 | 977 | 14859 | |
| 39 | Arunachal Pradesh | 169 | 3 | 9 | 12 | 181 |
| 40 | Assam | 1039 | 117 | 148 | 265 | 1304 |
| 41 | Manipur | 191 | 27 | 0 | 27 | 218 |
| 42 | Meghalaya | 207 | 82 | 0 | 82 | 289 |
| 43 | Mizoram | 95 | 23 | 8 | 31 | 126 |
| 44 | Nagaland | 123 | 11 | 1 | 12 | 136 |
| 45 | Tripura | 402 | 2 | 0 | 2 | 404 |
| 46 | Power Grid | 2.5 | 0.0 | 0 | 0.0 | 2.5 |
| North-Eastern Region | 2229 | 265 | 166 | 431 | 2659 | |
| Grand Total | 71876 | 7840 | 535 | 8375 | 80251 | |
| Note : | 1. Firm share includes capacity of dedicated CS stations, merchant power (75 MW each in ER and WR) and capacity allocated / diverted from other stations located within / outside the region. | |||||
| 2. Above allocation of unallocated power is for evening peak hours only (18-22 hours for WR, SR and NER, 19-22 hours for ER and 18-23 hours for NR). Allocation during off-peak hours may vary. | ||||||
| 3. The above allocation excludes power allocated to Bangladesh. Total Power allocated to Bangladesh = 250 MW (100 MW each from NR and WR and 50 MW from ER NTPC stations’ unallocated power. | ||||||
ANNEXURE-V
Details of the allocation of power from Central Generating Stations to each State/UT during the year (2018-19) as on 31.03.2019
| Details of Total Share of the States from Central Generating Stations |
(As on 31-03-2019) |
|||||
| S.No. | Region / State | Firm power | Unallocated (UA) Power | Total MW share from CGS | ||
| Firm Share from CGS (MW) | Unallocated power from regional pool (MW) | Allocation from other Region / Bhutan (MW) | Total allocation of unallocated power including specific allocation(MW) | |||
| 1 | Chandigarh | 160 | 96 | 14 | 110 | 271 |
| 2 | Delhi | 4078 | 0 | 30 | 30 | 4108 |
| 3 | Haryana | 2576 | 0 | 15 | 15 | 2591 |
| 4 | Himachal Pradesh | 1467 | 15 | 0 | 15 | 1482 |
| 5 | Jammu & Kashmir | 1776 | 645 | 118 | 763 | 2539 |
| 6 | Punjab | 2111 | 37 | 30 | 67 | 2178 |
| 7 | Rajasthan | 2693 | 635 | 52 | 687 | 3380 |
| 8 | Uttar Pradesh | 6033 | 660 | 100 | 760 | 6793 |
| 9 | Uttarakhand | 907 | 182 | 0 | 182 | 1089 |
| 10 | Railways | 0 | 0 | 0 | 0 | 0 |
| 11 | Power Grid | 7 | 4 | 0 | 4 | 12 |
| Northern Region | 21808 | 2275 | 359 | 2634 | 24442 | |
| 12 | Chhattisgarh | 1501 | 25 | 0 | 25 | 1526 |
| 13 | Gujarat | 3995 | 0 | 0 | 0 | 3995 |
| 14 | Madhya Pradesh | 4873 | 404 | 40 | 444 | 5317 |
| 15 | Maharashtra | 6949 | 329 | 0 | 329 | 7278 |
| 16 | Daman & Diu | 181 | 145 | 0 | 145 | 326 |
| 17 | Dadar Nagar Haveli | 255 | 724 | 0 | 724 | 979 |
| 18 | Goa | 504 | 99 | 0 | 99 | 604 |
| 19 | Power Grid | 5.44 | 3 | 0 | 3 | 8.72 |
| 20 | Railways WR | 540 | 0 | 0 | 0 | 540 |
| 21 | HWP of DAE | 0 | 14 | 0 | 14 | 14 |
| 22 | BARC Facilities | 0 | 10 | 0 | 10 | 10 |
| Western Region | 18805 | 1754 | 40 | 1794 | 20598 | |
| 23 | Andhra Pradesh | 2002 | 517 | 75 | 592 | 2594 |
| 24 | Karnataka | 3527 | 582 | 300 | 882 | 4409 |
| 25 | Kerala | 1865 | 221 | 0 | 221 | 2086 |
| 26 | Tamil Nadu | 5938 | 499 | 0 | 499 | 6436 |
| 27 | Telangana | 2105 | 221 | 200 | 421 | 2525 |
| 28 | Pondicherry | 334 | 189 | 0 | 189 | 523 |
| 29 | NLC | 100 | 0 | 0 | 0 | 100 |
| 30 | Power Grid | 0 | 6 | 0 | 6 | 6 |
| Southern Region | 15871 | 2234 | 575 | 2809 | 18680 | |
| 31 | Bihar | 3068 | 629 | 12 | 641 | 3709 |
| 32 | DVC | 6445 | 8 | 8 | 16 | 6461 |
| 33 | Jharkhand | 596 | 138 | 5 | 143 | 739 |
| 34 | Odisha | 1635 | 77 | 6 | 83 | 1718 |
| 35 | West Bengal | 1765 | 86 | 18 | 104 | 1869 |
| 36 | Sikkim | 156 | 12 | 1 | 13 | 169 |
| 37 | Railway | 675 | 0 | 0 | 0 | 675 |
| 38 | Power Grid | 0 | 1 | 0 | 1 | 1 |
| Eastern Region | 14340 | 952 | 50 | 1002 | 15342 | |
| 39 | Arunachal Pradesh | 219 | 4 | 7 | 11 | 230 |
| 40 | Assam | 1116 | 124 | 139 | 263 | 1379 |
| 41 | Manipur | 199 | 28 | 0 | 28 | 227 |
| 42 | Meghalaya | 217 | 87 | 0 | 87 | 304 |
| 43 | Mizoram | 160 | 24 | 5 | 29 | 189 |
| 44 | Nagaland | 129 | 12 | 15 | 27 | 156 |
| 45 | Tripura | 446 | 2 | 0 | 2 | 448 |
| 46 | Power Grid | 2.5 | 0.0 | 0 | 0.0 | 2.5 |
| North-Eastern Region | 2488 | 281 | 166 | 447 | 2935 | |
| Grand Total | 73312 | 7496 | 1190 | 8686 | 81997 | |
| Note : | 1. Firm share includes capacity of dedicated CS stations, merchant power (75 MW each in ER and WR) and capacity allocated / diverted from other stations located within / outside the region. | |||||
| 2. Above allocation of unallocated power is for evening peak hours only (18-22 hours for WR, SR and NER, 19-22 hours for ER and 18-23 hours for NR). Allocation during off-peak hours may vary. | ||||||
| 3. The above allocation excludes power allocated to Bangladesh. Total Power allocated to Bangladesh = 250 MW (100 MW each from NR and WR and 50 MW from ER NTPC stations’ unallocated power. | ||||||
*****************