After Installing 60% of Global PV Capacity in 2016, What’s In Store for the Giant Chinese and U.S. PV Markets?


“By James Kurz, senior consultant, Apricum – The Cleantech Advisory”
The global PV market is roiling beneath a relatively calm surface; while the market appears to be plateauing globally, it features a mix of growing, steady and declining markets. In this article, we analyze the major global PV market drivers, particularly the factors behind the dramatic cost reductions in PV components and electricity. Given that in 2016, China and the USA represented about 60% of global PV installations with a combined total of about 45 GWp, we will explore the key market and policy dynamics in those countries and explain the rationale behind our forecast. In this article, the detailed analysis for the U.S. PV market is presented, while an in-depth China article will be published next month. Before taking a deep dive into those churning waters of the two largest PV markets, a high-level view of global trends is a valuable exercise.
Global trends
There are a number of ubiquitous trends that are driving PV installations in all markets as well as some that are more localized. These trends include the growing demand for electricity (which will eventually be boosted by electric vehicle penetration), the desire of societies to address the challenges of climate change, the aim of many countries to enhance energy security as well as several others. The most significant global trend is the continued cost decline of PV components and PV-generated electricity, which is driving PV adoption. Many of these drivers have led to huge growth in PV during 2016, however, Apricum projects that policy-related peaks and valleys in individual markets, particularly China, will result in a temporary plateau in growth globally in the coming years (as illustrated below in Figure 1).

There are several factors contributing to PV’s cost decline, which has surprised many industry experts. Firstly, the increasing employment of competitive auctions as the framework of choice for utility-scale PV energy procurement has had a major impact on the cost of PV-generated energy. As consortia of project developers and independent power producers (IPPs) seek to submit the lowest energy tariff bids, they put pressure upwards in the value chain to reduce costs as much as possible. The power of these competitive forces has led to prices of PV-generated electricity that are lower than most could have imagined even three years ago (see Figure 2 below).

While many initially dismissed some of these impressive tariffs as unfeasible, it has proven to be the new norm, at least for very large scale projects. A happy side effect is that the price declines across the value chain driven by large-scale competitive tenders also permeate into other market segments.
Secondly, repeated overcapacity caused by lumpy demand is also one of the major factors driving down component costs. Booms and busts in demand have been common across the PV industry caused by reductions or expiry of incentives in individual markets. The issue of lumpy demand is particularly prominent in China where over 10 GW were installed in a single month in June 2016. The resulting overcapacity following this ramp up resulted in huge pressure on pricing globally in the months that followed with modules deals reported below 35 USD cents/kWh. Explaining the factors that led to this lumpy demand will form part two of this article focusing on market trends in China.
Next, the onslaught of single-axis horizontal trackers has greatly increased the ability of PV power plants to get the most out of their modules. In sunny regions, the cost of single-axis horizontal trackers is easily offset by a 20–30% gain in yield. In efforts to drive down PV tariff bids, it is an obvious choice to use trackers where possible. Comparing, for example, a 25% gain in yield to an approximately 10% increase in cost, the decision on whether to use trackers for PV developers is clear. The increasing competitiveness and bankability of major tracker players have allowed for a major step down in the cost of electricity generated by PV.
Finally, the gradual increase in module efficiency of about 0.4% per year continues to lower PV system costs as higher power modules use less land, less BOS/Wp and quicker installation.
It is important to note that this major driver for PV installations is not all sunshine and rainbows. In the coming years, PV system prices are likely to decline faster than the growth in new PV installed capacity if current pricing patterns continue. This means the overall size of the global PV market in terms of revenues would decline for the first time in the coming years.
There are also some factors experienced globally that constrain PV adoption. These constraints include concerns about grid integration, regulatory uncertainty, existing electricity price and energy subsidies, quotas on capacity additions and more. Constraints are, however, better analyzed in the context of an individual market.
Global diffusion of PV demand
Currently, China is the dominant force in the PV industry and the size of its market has skyrocketed much faster than expected. Though China is in a league of its own at the moment, the USA is on the verge of joining the Asian PV behemoth in the top echelon of PV markets. After China and the USA, the next tier of PV “mega markets” includes Japan, which is declining as the government reforms its FiT program, and India, which is in the middle of a rapid growth phase. Figure 3 illustrates the relative sizes of the PV markets that surpassed one GWp installed in 2016.

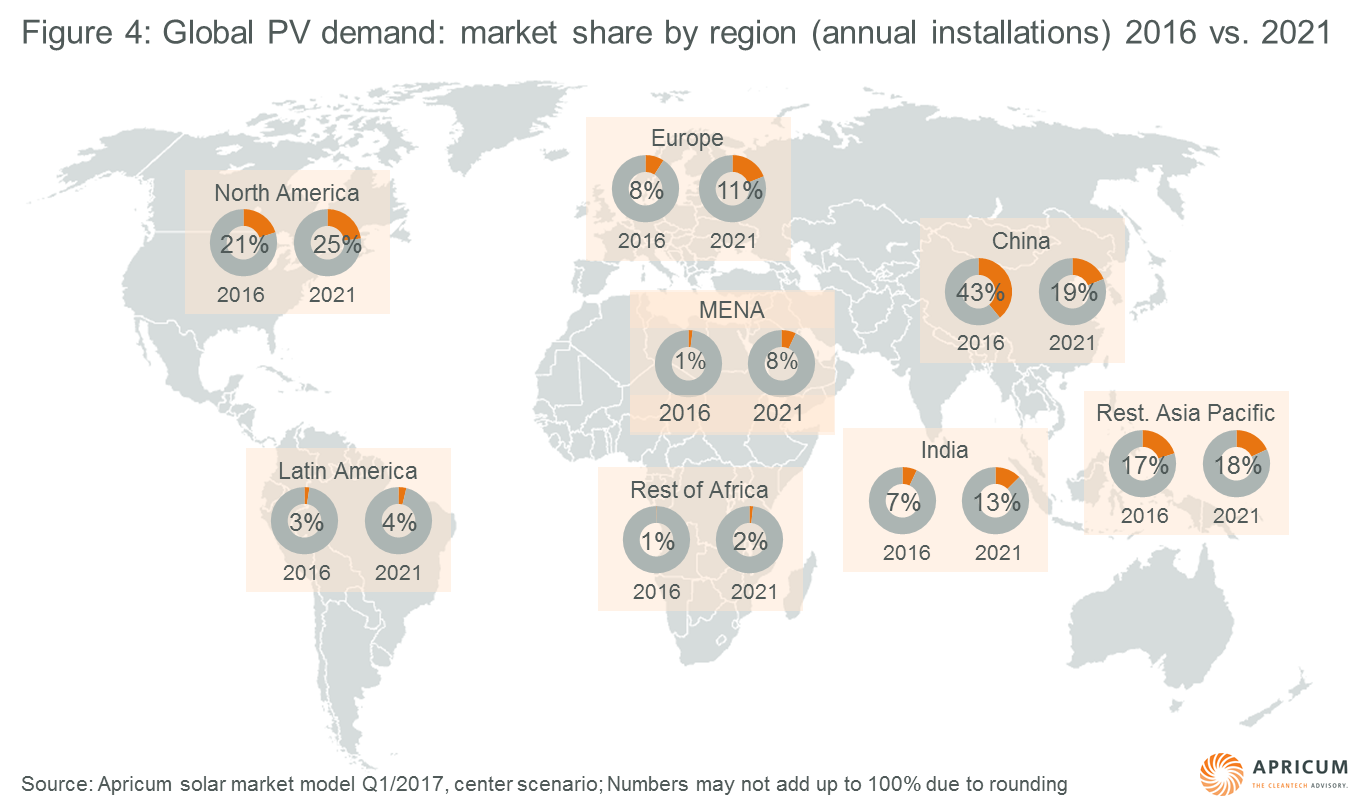
The Chinese government would like to cool down its PV market, but will also be very sensitive to damaging its solar manufacturing sector. Luckily other regions of the world, particularly, India, Asia Pacific (excluding China and Japan), North America and MENA are all in rapid growth stages. As the rest of the world picks up the pace, Apricum expects the Chinese government will act to control the level of PV installations in China going forward, leading to a more balanced map of global PV demand 5 years from now (as shown in Figure 4).
The fastest growing region of the world in terms of new installed capacity will be MENA. This region featured about 1 GWp of installations in 2016, a number which is expected to grow to 5 times that by 2021. Highlighting the huge growth potential in the region is the kick off this month of Saudi Arabia’s renewable energy tendering program, which features a first phase of 300 MW PV and 400 MW wind. Now that the status of the PV market globally has been illuminated, an in-depth view of the two largest markets will add some color to the picture.
China: The engine of the global PV solar industry currently dwarfs all other markets
After a massive year in which over 30 GWp was installed (almost half of the global PV market) and regulators announced a reduction in the country’s solar installation target, is China headed for a bust in 2017? Not so fast – the key conditions that led to the boom last year are in play again this year. Apricum’s next newsletter in March will contain a deep dive into the murky waters of the enormous Chinese PV market.
USA: After avoiding a major boom-bust cycle with ITC expiry, the U.S. market is poised for strong growth leading up to 2023
After growing 17% from 2014 to 2015, the U.S. solar market doubled in 2016 after about 14.6 GWp was installed. This result was even slightly higher than Apricum’s end-of-year high case estimate of 14.1 GWp, proving that the USA is now a solar market to be reckoned with as the second largest PV market globally. The surge of installations was largely due to a legacy effect of the former federal investment tax credit (ITC) legislation that was originally set to expire completely at the end of 2016. The ITC was infamously extended long term in a last ditch horse trade (ITC and production tax credit extensions for a lift on the crude oil export embargo) between Republicans and Democrats in December 2015. The solar industry had ramped up in a massive way to build out as much PV as possible before the “ITC cliff” and a large share of these projects could not be pushed forward as major project agreements were already signed. The sizable boost in installations in 2016 was a legacy effect of the former ITC rule, but how will the legislative changes affect the market going forward and what does a Trump presidency mean for the PV industry?
Initially, what drove development in the U.S. PV industry was a network of individual state renewable portfolio standards (RPS) policies. Binding RPS policies exist in 29 states and Washington D.C., while eight other states have non-binding renewable energy goals. Increasingly, however, the driver for PV adoption in many markets is price rather than RPS rules. This trend can be observed in states without RPS targets or with already attained targets, which are now heavily developing PV, such as Georgia, Florida, Texas and others.
Continuous capacity demand
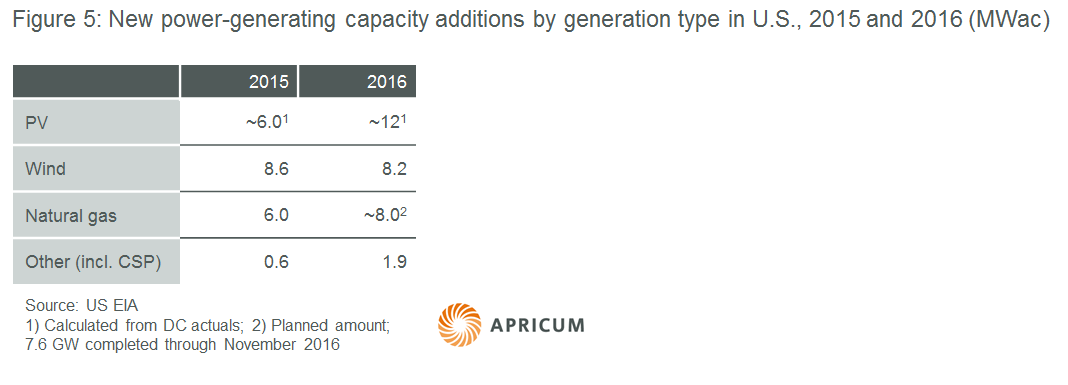
Turning to the American electricity sector, electricity generation/consumption has remained relatively stable over the past 10 years with some fluctuations occurring between 2008 and 2010 as a result of the global financial crisis. Because the country has an enormous, very mature electricity market, however, old plants are constantly being retired and need to be replaced. The U.S. Energy Information Administration (EIA) forecasts the retirement of over 34 GW of generating capacity, including about 17 GW of coal, 10 GW of natural gas and 5.5 GW of nuclear, between 2016 and 2020. A total of 8.7 GW of power plants were retired in 2016 through November, with around 25 GW additionally planned to be retired through 2020. This capacity is expected to be replaced primarily with natural gas, solar and wind power and if recent trends continue, the majority will be solar and wind as seen in Figure 5.
Clearly, the country needs to add electricity generating capacity and solar is one of the most preferred sources. Utilities and independent system operators are tasked with reliably supplying electricity to meet demand according to load patterns and according to state laws like RPS. In states with a low existing penetration of PV, like many in the south east, adding PV will not cause any reliability issues. As long as reliability and RPS conditions are met, the decisive factor is the cost of energy, which the ITC law heavily reduces for PV plants.
The ITC saga continues
Without going into the arcane details, the ITC legislation gives a tax credit relative to the total capital expenditure associated with the project to owners of PV power plants; it essentially reduces the CAPEX by 30%, and thus the overall cost of energy by approximately the same amount. This massive financial incentive is being gradually stepped down – as shown in Figure 6 – and will largely determine the pattern of PV installations over the coming eight years in the USA.
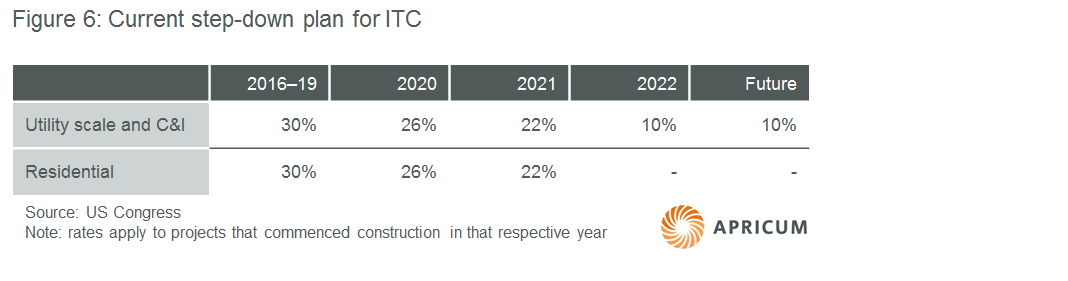
The extended ITC includes a commencement rule that states projects must be completed by the end of the fourth calendar year after construction has commenced. In other words, a project that has commenced construction in 2018 must be completed by December 31, 2022 to be eligible for the tax credit. The ITC rates are related to the year the project has commenced construction, therefore the example project started in 2018 would receive the full 30% tax credit. Project commencement is defined as either 5% of the total project value being spent or continuous physical work being started at the project site. All utility-scale and commercial & industrial projects that are not completed before the end of 2023 will receive the 10% ITC.
Taking into account the constant decline in PV component prices, it is clearly in the favor of project developers working on utility-scale projects to delay component procurement and the bulk of construction as long as possible after commencement rule has been satisfied. Apricum projects that the effect of developers seeking to delay construction will be a prominent buildup of projects under construction leading to a major boom in installations in 2023 (beyond our current forecast). There are of course limitations on developers, which include states striving for meeting annual RPS targets and utilities that need to replace retired power generating capacity between 2017 and 2023, and therefore significant demand will remain prior to 2023.
The commencement rule has a limited impact on residential and commercial scale projects because of much shorter construction times and usually a demand from the customer to complete the project quickly. Therefore Apricum predicts growth will remain steady in these two segments until 2019, when a boost in installations will be seen through 2021. In 2022 we expect both the residential and C&I segments to decline significantly following the reduction in the ITC before resuming steady, unsubsidized growth. The drop will not be as dramatic as in the utility-scale segment because purchase decisions are more multi-faceted, for example, involving aspects like rooftop condition/age, corporate sustainability aims, desire to “go green” and more.
The “Trump effect”
What about Trump? Does he and his cabal of appointed climate science deniers plan to abolish anything related to clean energy? Trump’s main problem with renewables, according to his public statements, is that they are too expensive. This is clearly a misconception given the drastic cost declines across the industry; so once the facts are provided, Trump’s main point of contention will be proven false. What if he still wants to attack renewable energy? (A definite possibility.) Firstly, the president has little ability to affect state-level policy, like RPS, and the Trump presidency may in fact embolden some state legislators to accelerate clean energy plans. An example of this can already be seen in California this month where a bill calling for 100% renewables in the electricity mix by 2045 was introduced. When it comes to federal regulations, there are two main policies with a current or expected impact on PV deployment: the ITC and the Clean Power Plan, which was designed to reduce emissions in the electricity sector starting in 2022.
Because the Clean Power Plan was enacted through executive action via the Environment Protection Agency and not through legislation via Congress, it is highly vulnerable to being cancelled and indeed Trump has promised to do so. Whether he cancels the program or not does not affect Apricum’s forecast, which runs through 2021, but beyond 2022 it may result in coal plants operating longer and thus reduce the demand for new clean energy capacity. Then again, an entirely new president could already be in place by that time.
One way the Trump administration could potentially affect the PV industry directly via legislative action is through the Internal Revenue Service (IRS). If changes to commencement rules or accelerated depreciation, for example, are made through executive actions, there will be an impact on solar project economics.
Aside from executive actions, Republican lawmakers may attempt to change legislation to the detriment of the PV industry. Congress is preparing a comprehensive tax reform bill to be introduced in late 2017 or 2018 that aims to, among other things, slash the corporate tax rate. The ITC could be a victim of this “grand bargain” on tax reform, which will need to remove some tax exemptions to increase revenues. If a law is passed by Congress in early 2018 that includes the elimination of the ITC, a huge number of projects will have already commenced construction according to commencement rules – developers will have made sure of this –and will be installed through 2021/2022.
Presently, concrete tax policy plans include a slashing of the corporate tax rate to 20% and Trump even prefers a 15% flat rate (currently corporate taxes are 15–35%). With a smaller overall tax burden, the need for tax equity investments will be reduced, though most industry professionals still expect ample demand. Even if the current administration manages to enact new legislation to abolish the ITC sooner than planned under the existing laws, Apricum still expects the PV market to grow significantly through 2021.
U.S. PV market outlook
In summary, the federal government has little impact on state policies and where the federal government has the power to act (the Clean Power Plan and federal tax law), it is unlikely to dramatically affect PV demand over the next five years. While the Trump administration is likely to be bad news for the climate, Apricum expects it will have limited impact on the U.S. PV market through until 2021.
Apricum – The Cleantech Advisory linked to www.apricum-group.com