


Continued warm, wet conditions in the second quarter of 2017 brought a departure from normal global horizontal irradiance, the key variable for PV plant production.
GTM has partnered with Vaisala, a company that monitors solar performance across the U.S., to give the industry a better understanding of how these weather trends are driving solar performance around the country.
The most recent set of maps evaluate departure from normal solar resource conditions in the second quarter of 2017.
Spring 2017 did not follow the usual climatological script. Rather, following the trend from the first quarter of the year, Q2 overall featured continued warm and wet weather for much of the contiguous U.S.
As illustrated by Vaisala’s Q2 map, wet and cloudy conditions prevailed in the Northeast, Southwest, and Upper Midwest while clear and dry conditions were experienced in the Southeast and the Plains region. This pattern of above- and below-normal solar conditions across the country is also consistent with extreme temperature and precipitation conditions recorded by NOAA for the second quarter.
The contiguous United States had its second warmest year-to-date, from January to June 2017. Nationally, extremes in maximum and minimum warm temperatures, one-day precipitation totals, days with precipitation, the spatial extent of wetness, and land-falling tropical cyclones were all above average. The U.S. Climate Extremes Index (USCEI) for the year-to-date was the third highest value on record at more than double the average.
On the regional scale, the Northeast, Upper Midwest, Ohio Valley, Southeast, South, and West each had record or near-record high CEI value for the year-to-date. In the Northeast and Upper Midwest, the number of days with precipitation was significantly above average, leading to lower-than-normal solar resource. One-day precipitation totals and days with precipitation in the Ohio Valley were also well above normal.
Parts of the southeastern U.S. experienced drought conditions at the start of Q2, with wildfires burning in Florida and southern Georgia. They later saw a significant transition with near eradication of drought due to intense rainfall events during the month of June. In the South and in the West, single day precipitation totals showed significant departures from normal conditions with spatial coverage and days with precipitation being well above average.
Warmer-than-normal winter and spring conditions have a direct effect on the energy industry because they reduce energy demand related to heating. As with Q1 2017, energy demand in Q2 was extremely low. For context, the contiguous U.S. temperature-related energy demand during Spring 2017 was the fourth lowest in the 123-year period of record, according to data from NOAA’s Residential Energy Demand Temperature Index (REDTI).
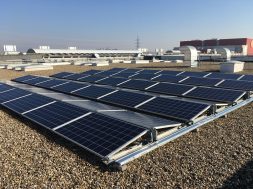
These conditions also affected the solar industry because wetter spring time weather typically comes with significant cloud cover, reducing the available solar resource. This has the obvious effect of reduced power production and decreased project revenue, but can have the added consequence of bringing negative attention to solar in locations where it may not be politically stable.
One example is Minnesota where the solar energy capacity of the state rose 80 percent during the first half of 2017. This was after a consecutive quarter of leapfrog growth as several major solar arrays were switched on. Altogether, Minnesota’s solar arrays have the capacity to crank out roughly the same amount of power as one of Xcel Energy’s larger natural gas-fired plants — at least when skies are clear and sunny.
And there lies the challenge. Without the ability to properly attribute weather as the cause of lower-than-expected performance and rougher-than-planned grid integration, the local solar industry runs the risk of backlash from utilities and politicians opposed to the newly installed systems.
Looking at Vaisala’s Solar Performance Map of the second quarter, the observed regional pattern of negative and positive anomalies speaks to the importance of weather impacts on project performance even when the installations are small.
For more details, read our month-by-month summaries below to learn how specific weather conditions and anomalous patterns throughout April, May, and June may have influenced solar production across your portfolio.
April
A highly variable upper-level circulation sent many troughs and slow-moving closed lows across the contiguous United States (CONUS), which left bouts of cooler weather, heavy precipitation, and severe storms in their wake, especially at the beginning and end of the month. The overall circulation pattern and its widespread above-normal precipitation caused the U.S. to have the second wettest April on record.
Weather across the country this month was dominated by a highly variable jet stream circulation, which dropped above-normal precipitation across much of the country, especially in Hawaii, the West, Plains, Midwest, and parts of the Southeast. Above-normal precipitation in the Pacific Northwest meant three different states experienced their top 10 wettest April within the 123-year record. The associated cloud coverage produced solar resource anomalies of 5 percent or greater below normal for the month.
These jet stream conditions and their southerly flow funneled moisture from the Gulf of Mexico into the Southern Plains to Ohio Valley, and parts of the Southeast, with heavy rains causing extensive flooding along the Mid-Mississippi Valley. North Carolina had the wettest April on record, which threatened some newly installed solar farms and forced their owners to monitor flood plains and deal with groundwork issues.
May
Like April, May 2017 did not follow the usual climatological patterns. Similar to the previous month, a highly meridional and variable upper-level circulation sent many troughs and slow-moving closed lows across the U.S., which left bouts of cooler weather, heavy precipitation, and severe storms in their wake.
The highly variable jet stream circulation continued into May with above-normal precipitation across much of the eastern half of the country, especially from the lower Mississippi Valley to the Ohio Valley and central Appalachians. The fronts and upper-level lows triggered periods of severe weather and kept temperatures cooler-than-normal across much of the central U.S.
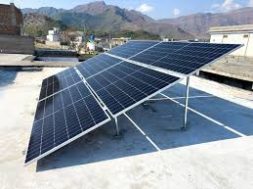
Cold fronts and low-pressure systems combined with the upper-level lows to create unstable air and dynamics favorable for severe weather. A particularly strong, widespread, and severe weather outbreak occurred at mid-month, covering Colorado in a blanket of snow. It also dropped hailstones up to 2.75 inches in diameter onto the NREL research facility. Miraculously, out of 3,168 solar panels at NREL’s Research Support Facility only one sustained damage, a true testament to the resilience of PV technology.
For areas not in the path of these weather systems, the month was drier than normal with eight states in the Plains and West having below-average precipitation for May. These drier-than-normal conditions contributed to above average solar resources, particularly in Montana, which unfortunately does not currently have many solar project installations to take advantage of the excellent conditions.
June
Solar adoption in the Southeast has taken off. North Carolina moved into second place and Georgia has claimed eighth position on the list of top 10 solar states. Unfortunately, the weather did not cooperate with the increase in solar plants in these states by bringing sunny weather. Instead, June’s weather negatively impacted available solar resources during what should have been a high production month.
Areas of heavy rain were experienced, especially along the Gulf Coast, with accompanying low solar resource conditions affecting projects in the area. High levels of rain in the South and Northeast meant five states ranked in the top 10 wettest category — Florida, Alabama, Mississippi, Louisiana, and Vermont.
Cold fronts and surface low pressure systems moving in the jet stream flow east of the Rockies were funneled into the eastern and southern U.S. by the long-wave trough where they tapped moisture from the Gulf of Mexico and Atlantic Ocean.
Without inhibitors related to ENSO (the El Niño-Southern Oscillation) shearing tropical systems, the Atlantic and East Pacific saw slightly more vigorous tropical cyclone activity than average. The Atlantic hurricane season typically runs from June 1 through November 30, and two tropical systems developed in the North Atlantic during June. The cloudiness and rain which accompanied Tropical Storm Cindy gave several states in the Southeast a cooler-than-normal June in addition to being wetter than normal.
The fronts from the North and systems from the South diverged around the Mid-Atlantic region, contributing to a sunnier-than-normal month for an area encompassing Delaware, Maryland, and Virginia. The system that moved across the West brought rain during the second and third weeks, but the ridge kept most of the West and Great Plains sunnier-than-normal and the monthly average was near normal.